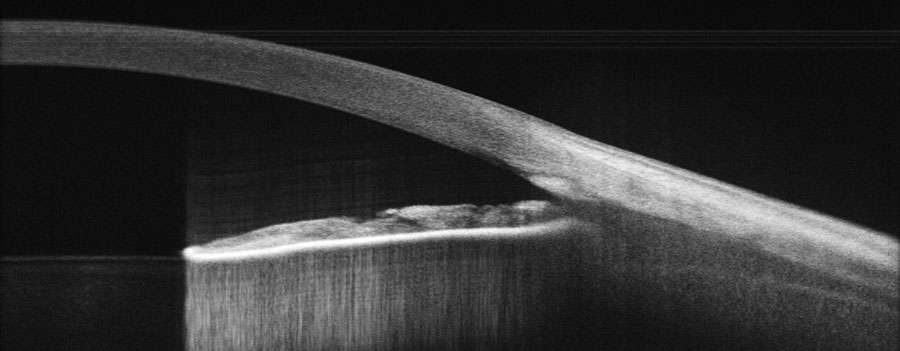
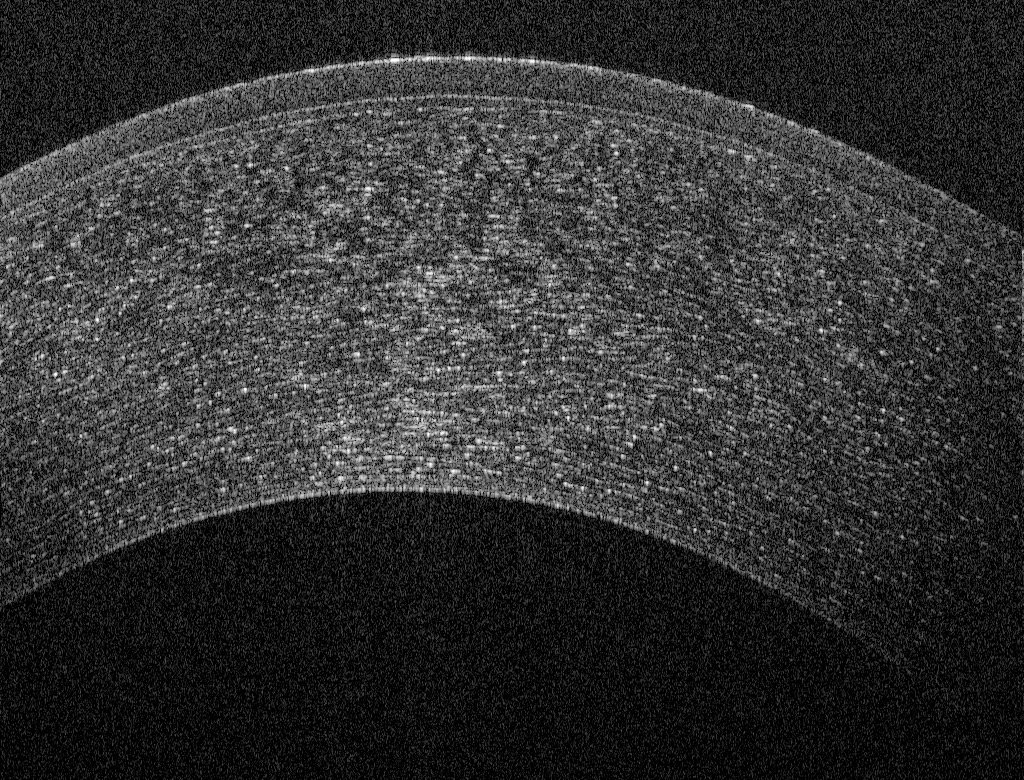
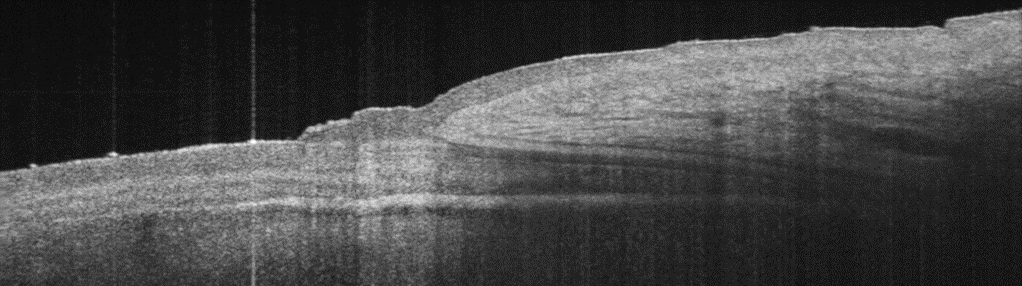
Cross-section of anterior segment of human eye showing iridocorneal angle, the angle formed between the cornea and the iris, taken using a Cobra 1300 OCT spectrometer. The structure is considered important in diagnosing eye conditions like glaucoma.
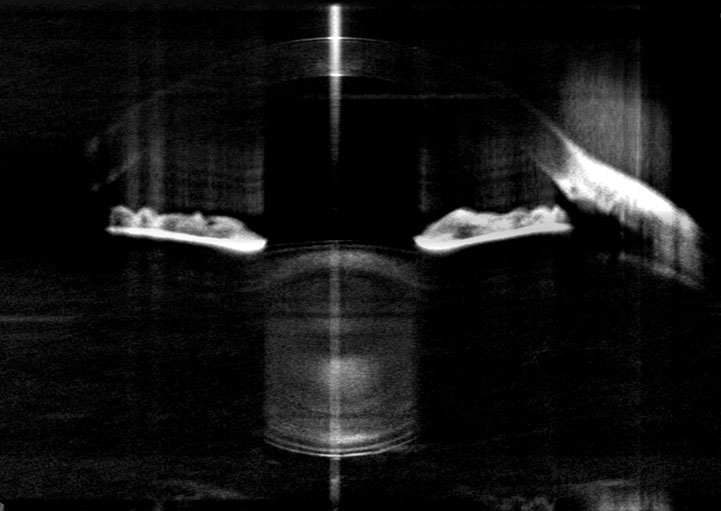
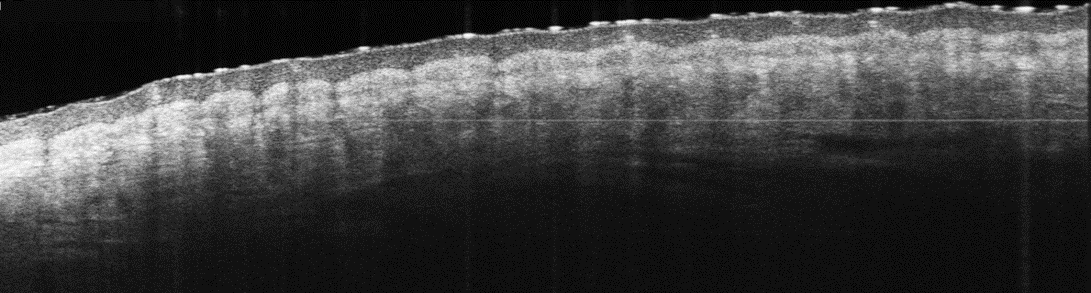
Cross-section of entire anterior chamber of human eye. The image showing cornea on the top, followed by iris and crystalline lens was acquired using an ultra-deep penetration model of the Cobra 1300 OCT spectrometer.

OCT image of ciliary muscle right next to the iris, taken using a Cobra 1300 OCT spectrometer. Ciliary muscle is critical controlling accommodation of eye that helps us change the focus from near to distant objects.
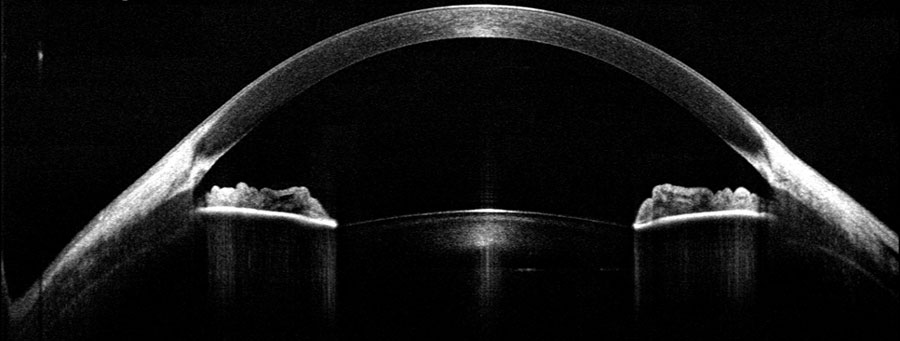
OCT image showing cross-section of human cornea with iris and top surface of crystalline lens, acquired using a Cobra 1300 OCT spectrometer.
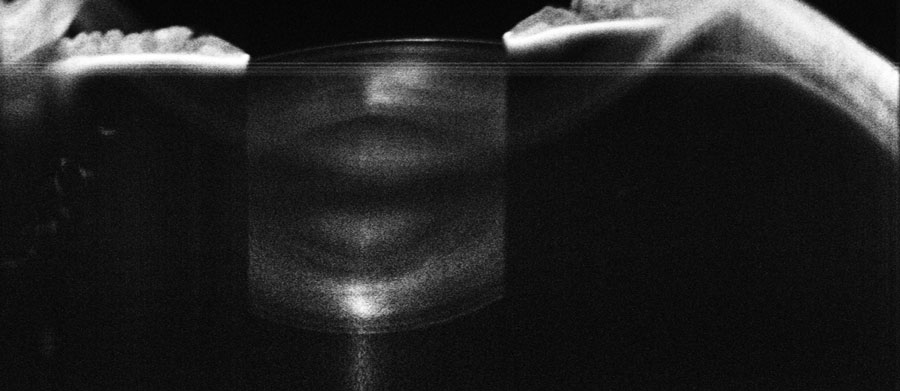
OCT image focused deeper into the human eye anterior chamber. The image showing high-resolution view of crystalline lens was acquired using a Cobra 1300 OCT spectrometer with custom focusing optics.
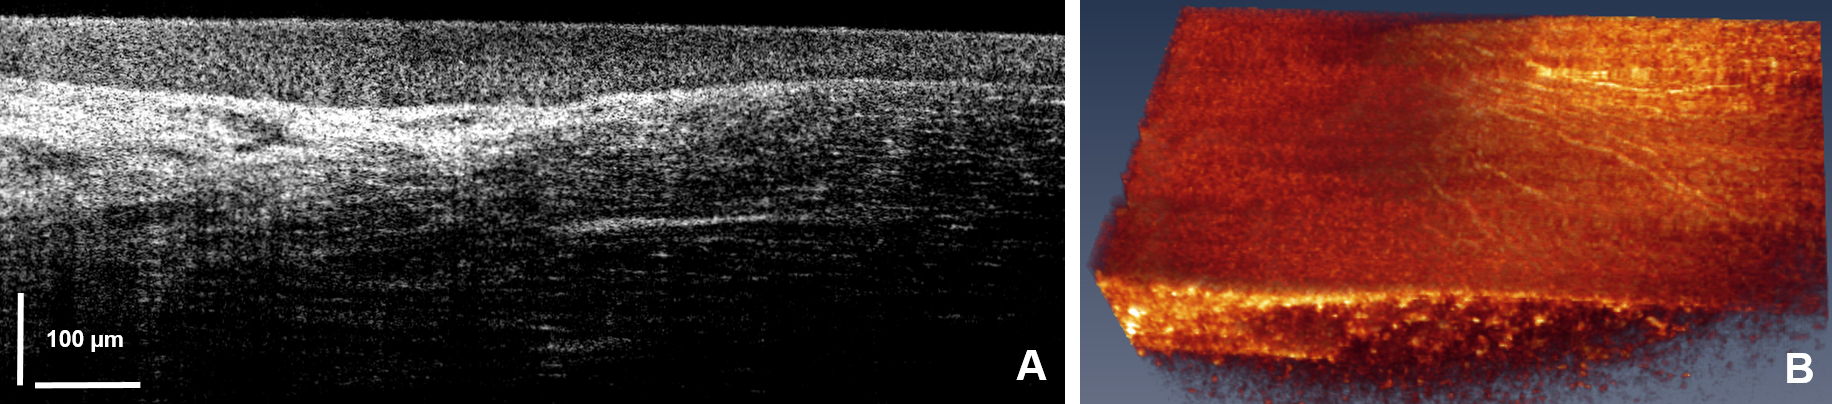
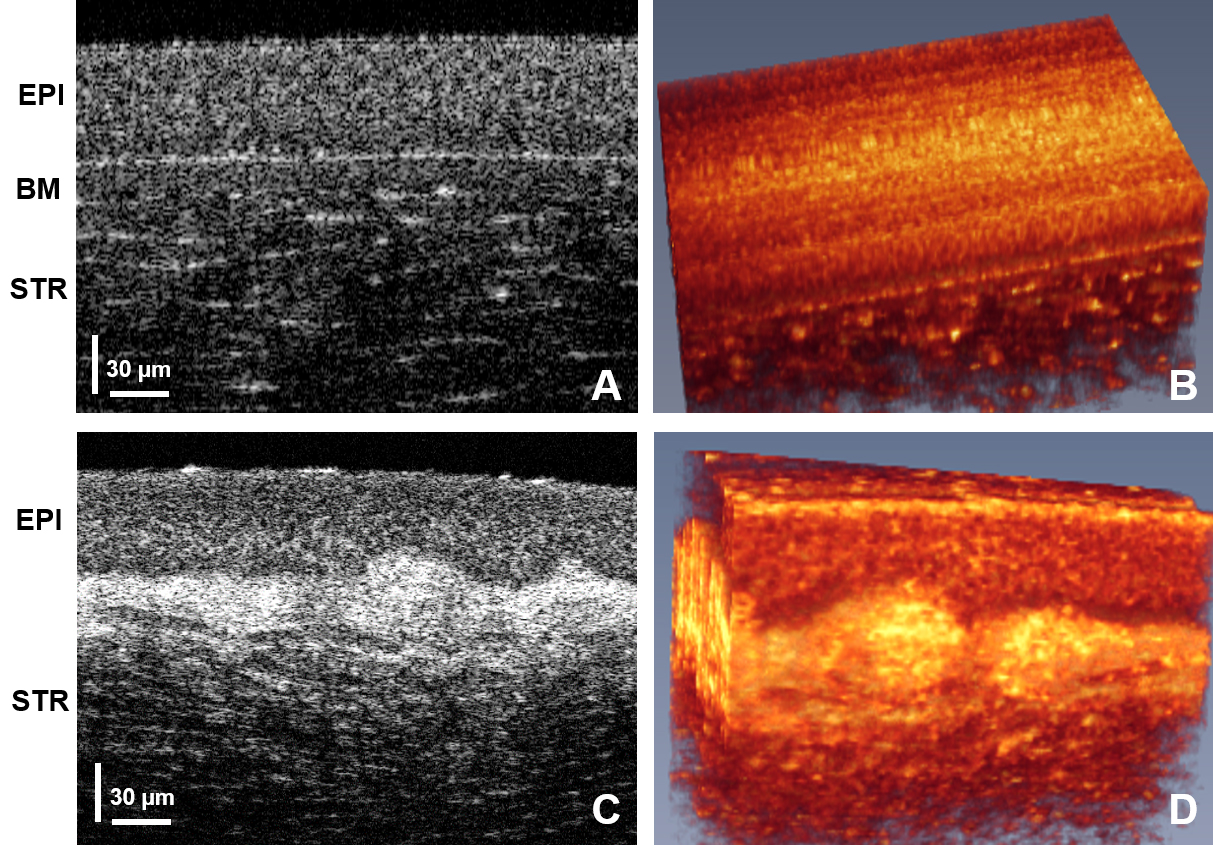
These high-resolution corneal images were taken with a system built using a Cobra-S 800 spectrometer: (a) A cross section of a healthy cornea showing normal tear film (TF), (b) In vivo volume of the healthy cornea, (c) Similar layers in a keratoconus patient showing irregular TF and loss of structure between epithelium and Bowman’s layer, and (d) In vivo volume of the keratoconus eye. EPI: epithelial layer; BM: Bowman’s layer; STR: stroma. Images courtesy of Professor Kostadinka Bizheva, University of Waterloo.
This high-resolution, high-speed corneal image acquired close to the limbal region was taken with a system built using a Cobra-S 800 spectrometer. Corneal nerves can be seen, both in (a) a cross section and (b) a volumetric image. Images courtesy of Professor Kostadinka Bizheva, University ofWaterloo.
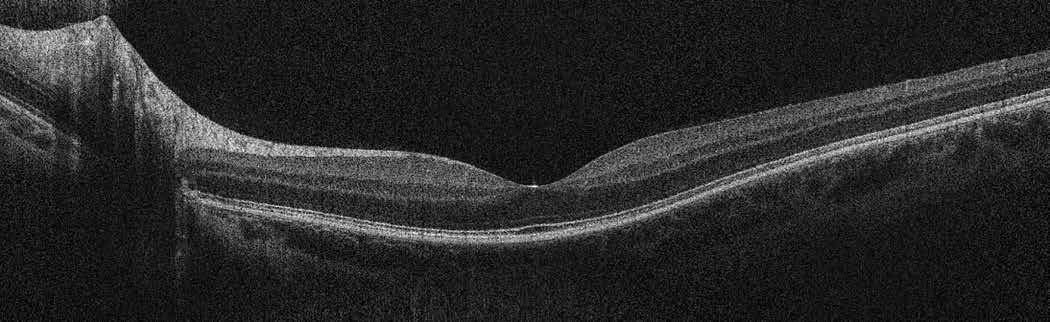
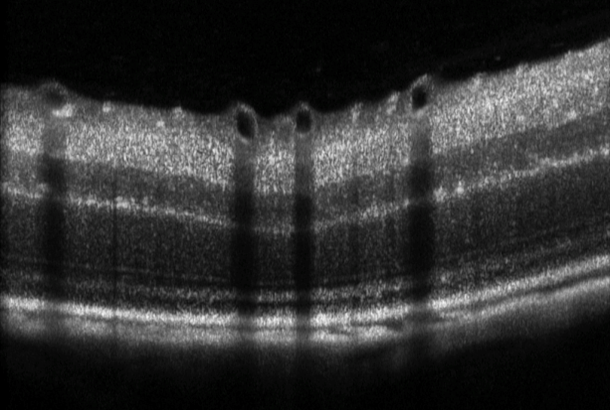
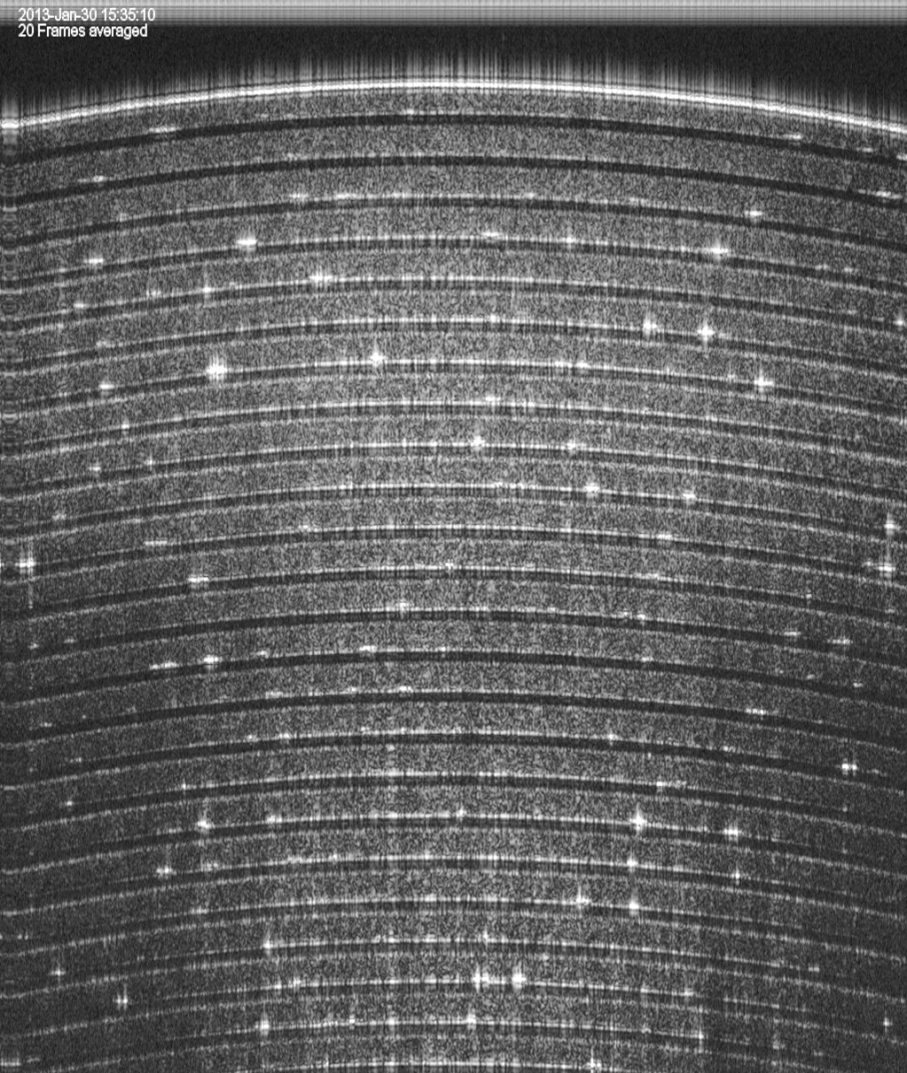
An ultrafast SD-OCT image of human retina provides both wide-field and high-resolution images. This image was acquired using a Cobra-S OCT spectrometer. No averaging of the data was performed. The image was acquired at a 128-kHz A-line rate, with an expected axial resolution of 3 μm in tissue. Courtesy of James Fujimoto, MIT.
High-resolution corneal image showing epithelium, Bowman’s layer, and stroma acquired using high-resolution 800 nm SD-OCT.

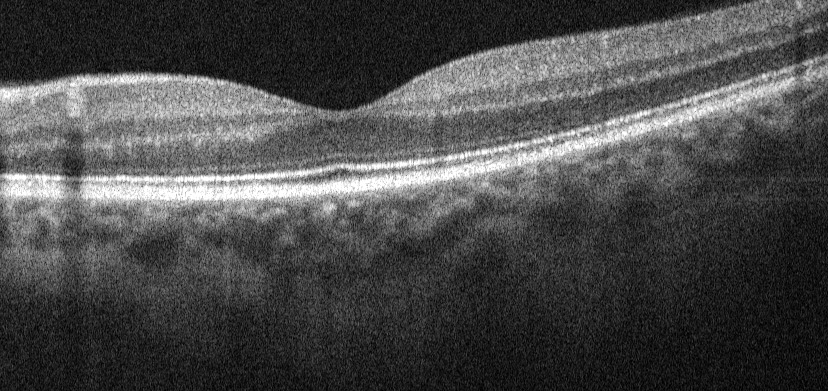
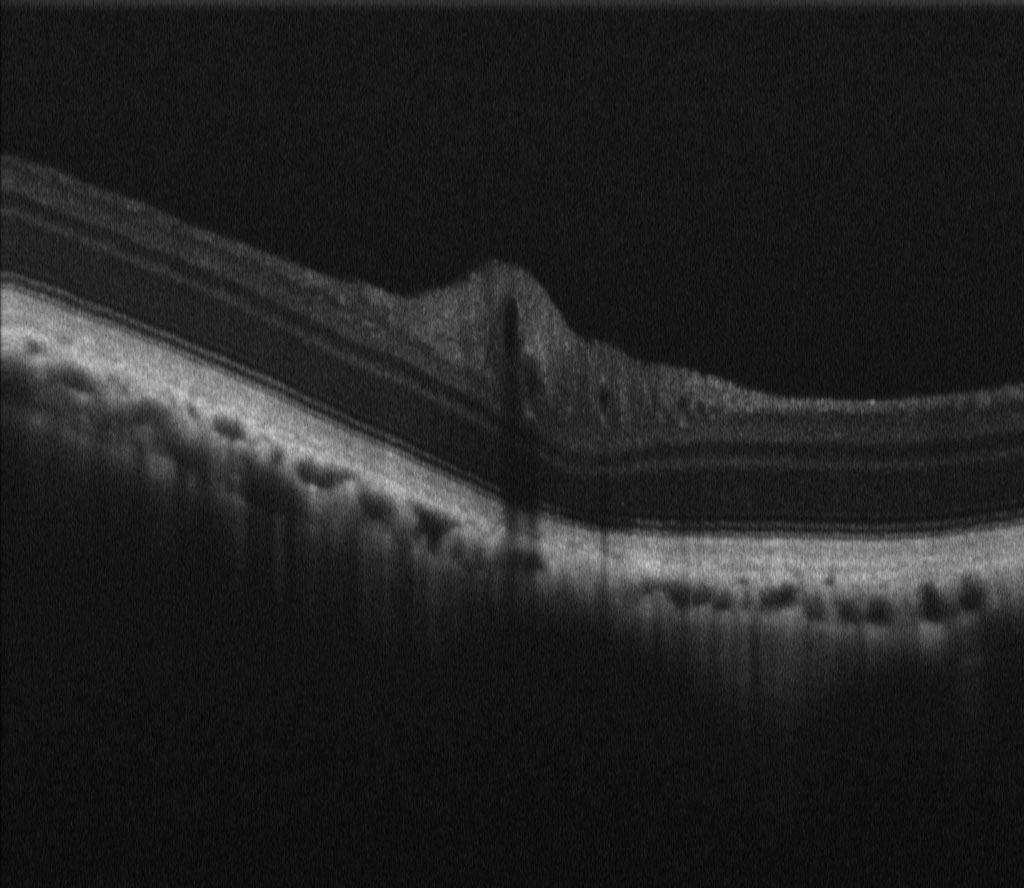
Retinal image acquired using spectral-domain OCT at 1050 nm. The longer wavelength allows deeper penetration in the tissue allowing clearer visualization of choroid. The system retains simplicity associated with spectral-domain technology.
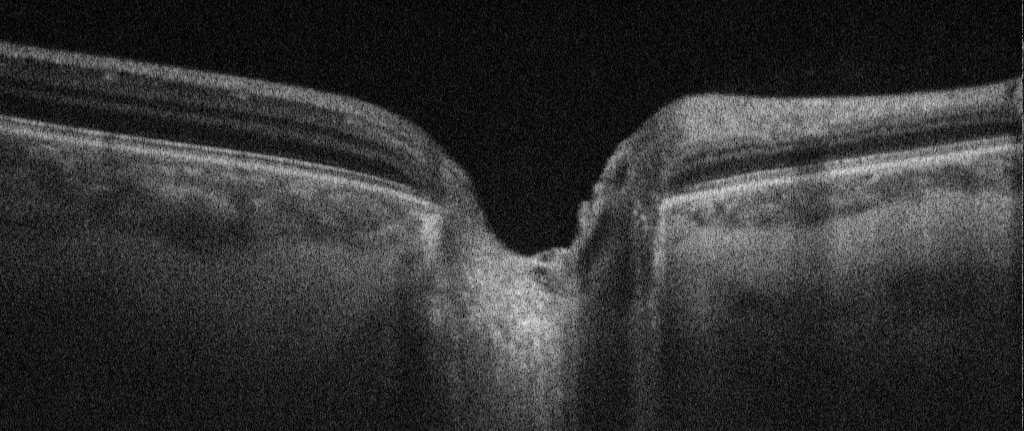
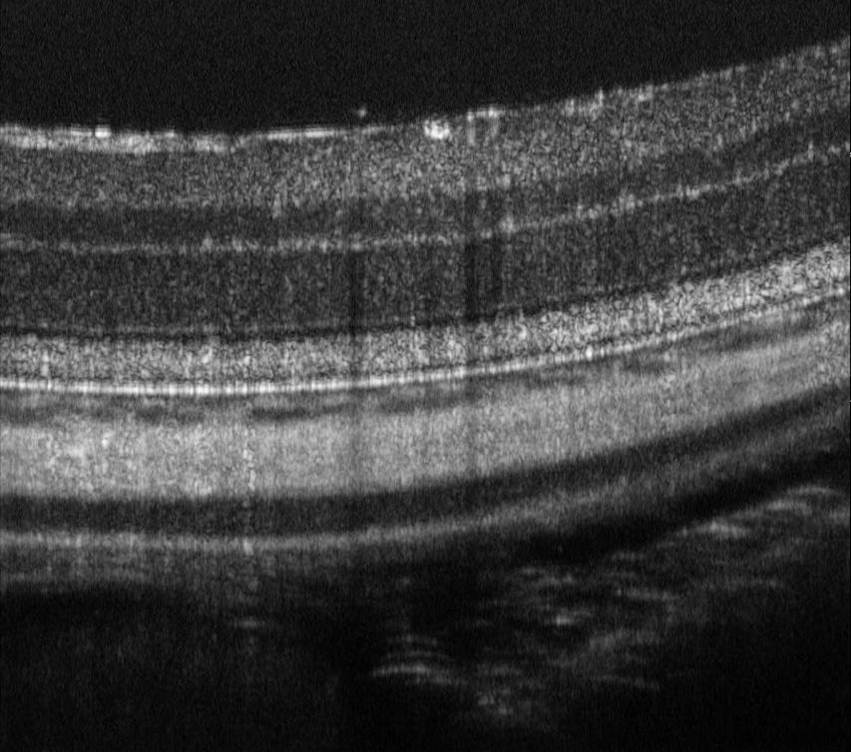
OCT cross-section of optic nerve from human volunteer acquired using 1050 nm. Longer wavelength allows deeper penetration and extended depth of imaging allowing clear visualization of optic nerve anatomy.
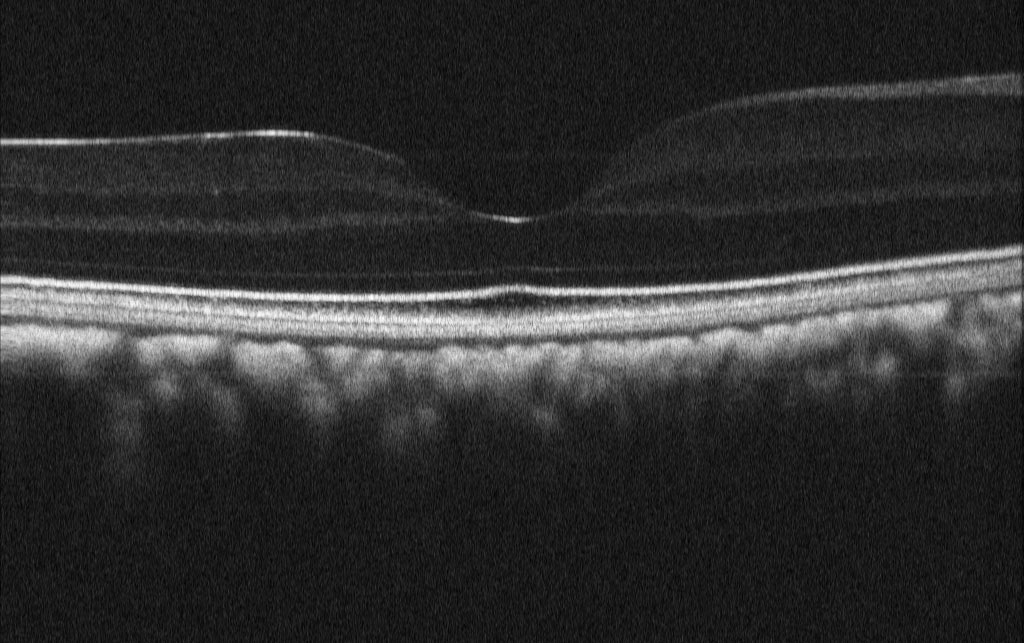
High sensitivity, high resolution image of retina taken from a human volunteer using an 800 nm system based on a Cobra-S OCT spectrometer, imaging well into the choroid.

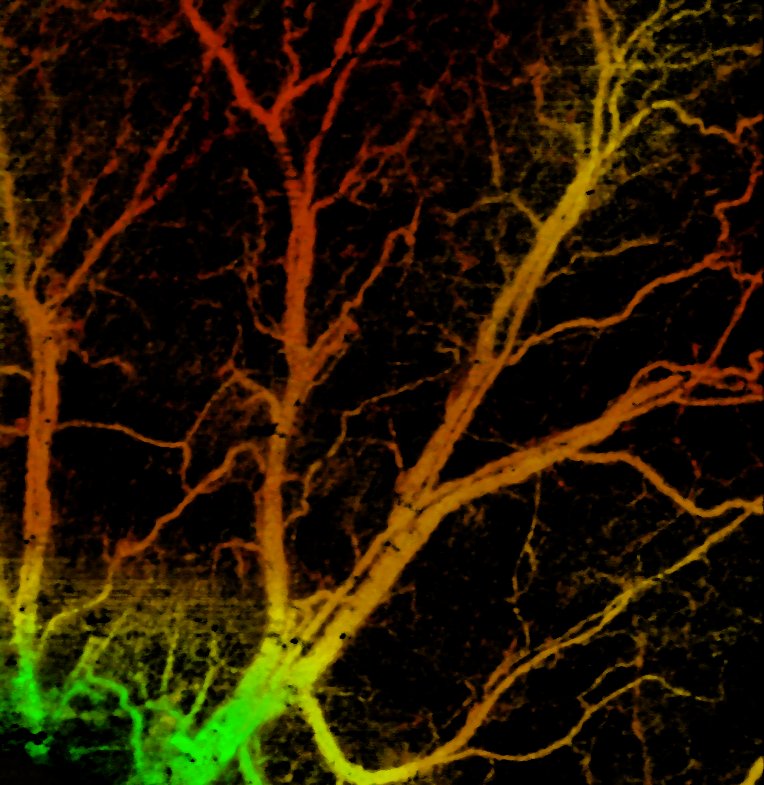
OCT angiography image of mice retina shows both large and micro-vessels at different depth locations using intrinsic contrast only. The false color in the image encodes the depth location of the blood vessels. Image taken with 800 nm system using a Cobra 800 spectrometer. The vasculature contrast was generated using OCT angiography.
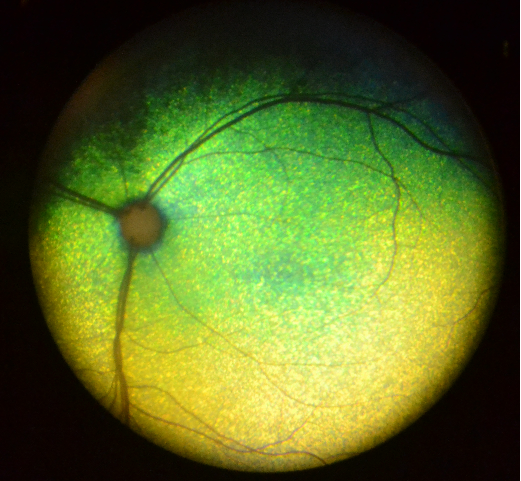
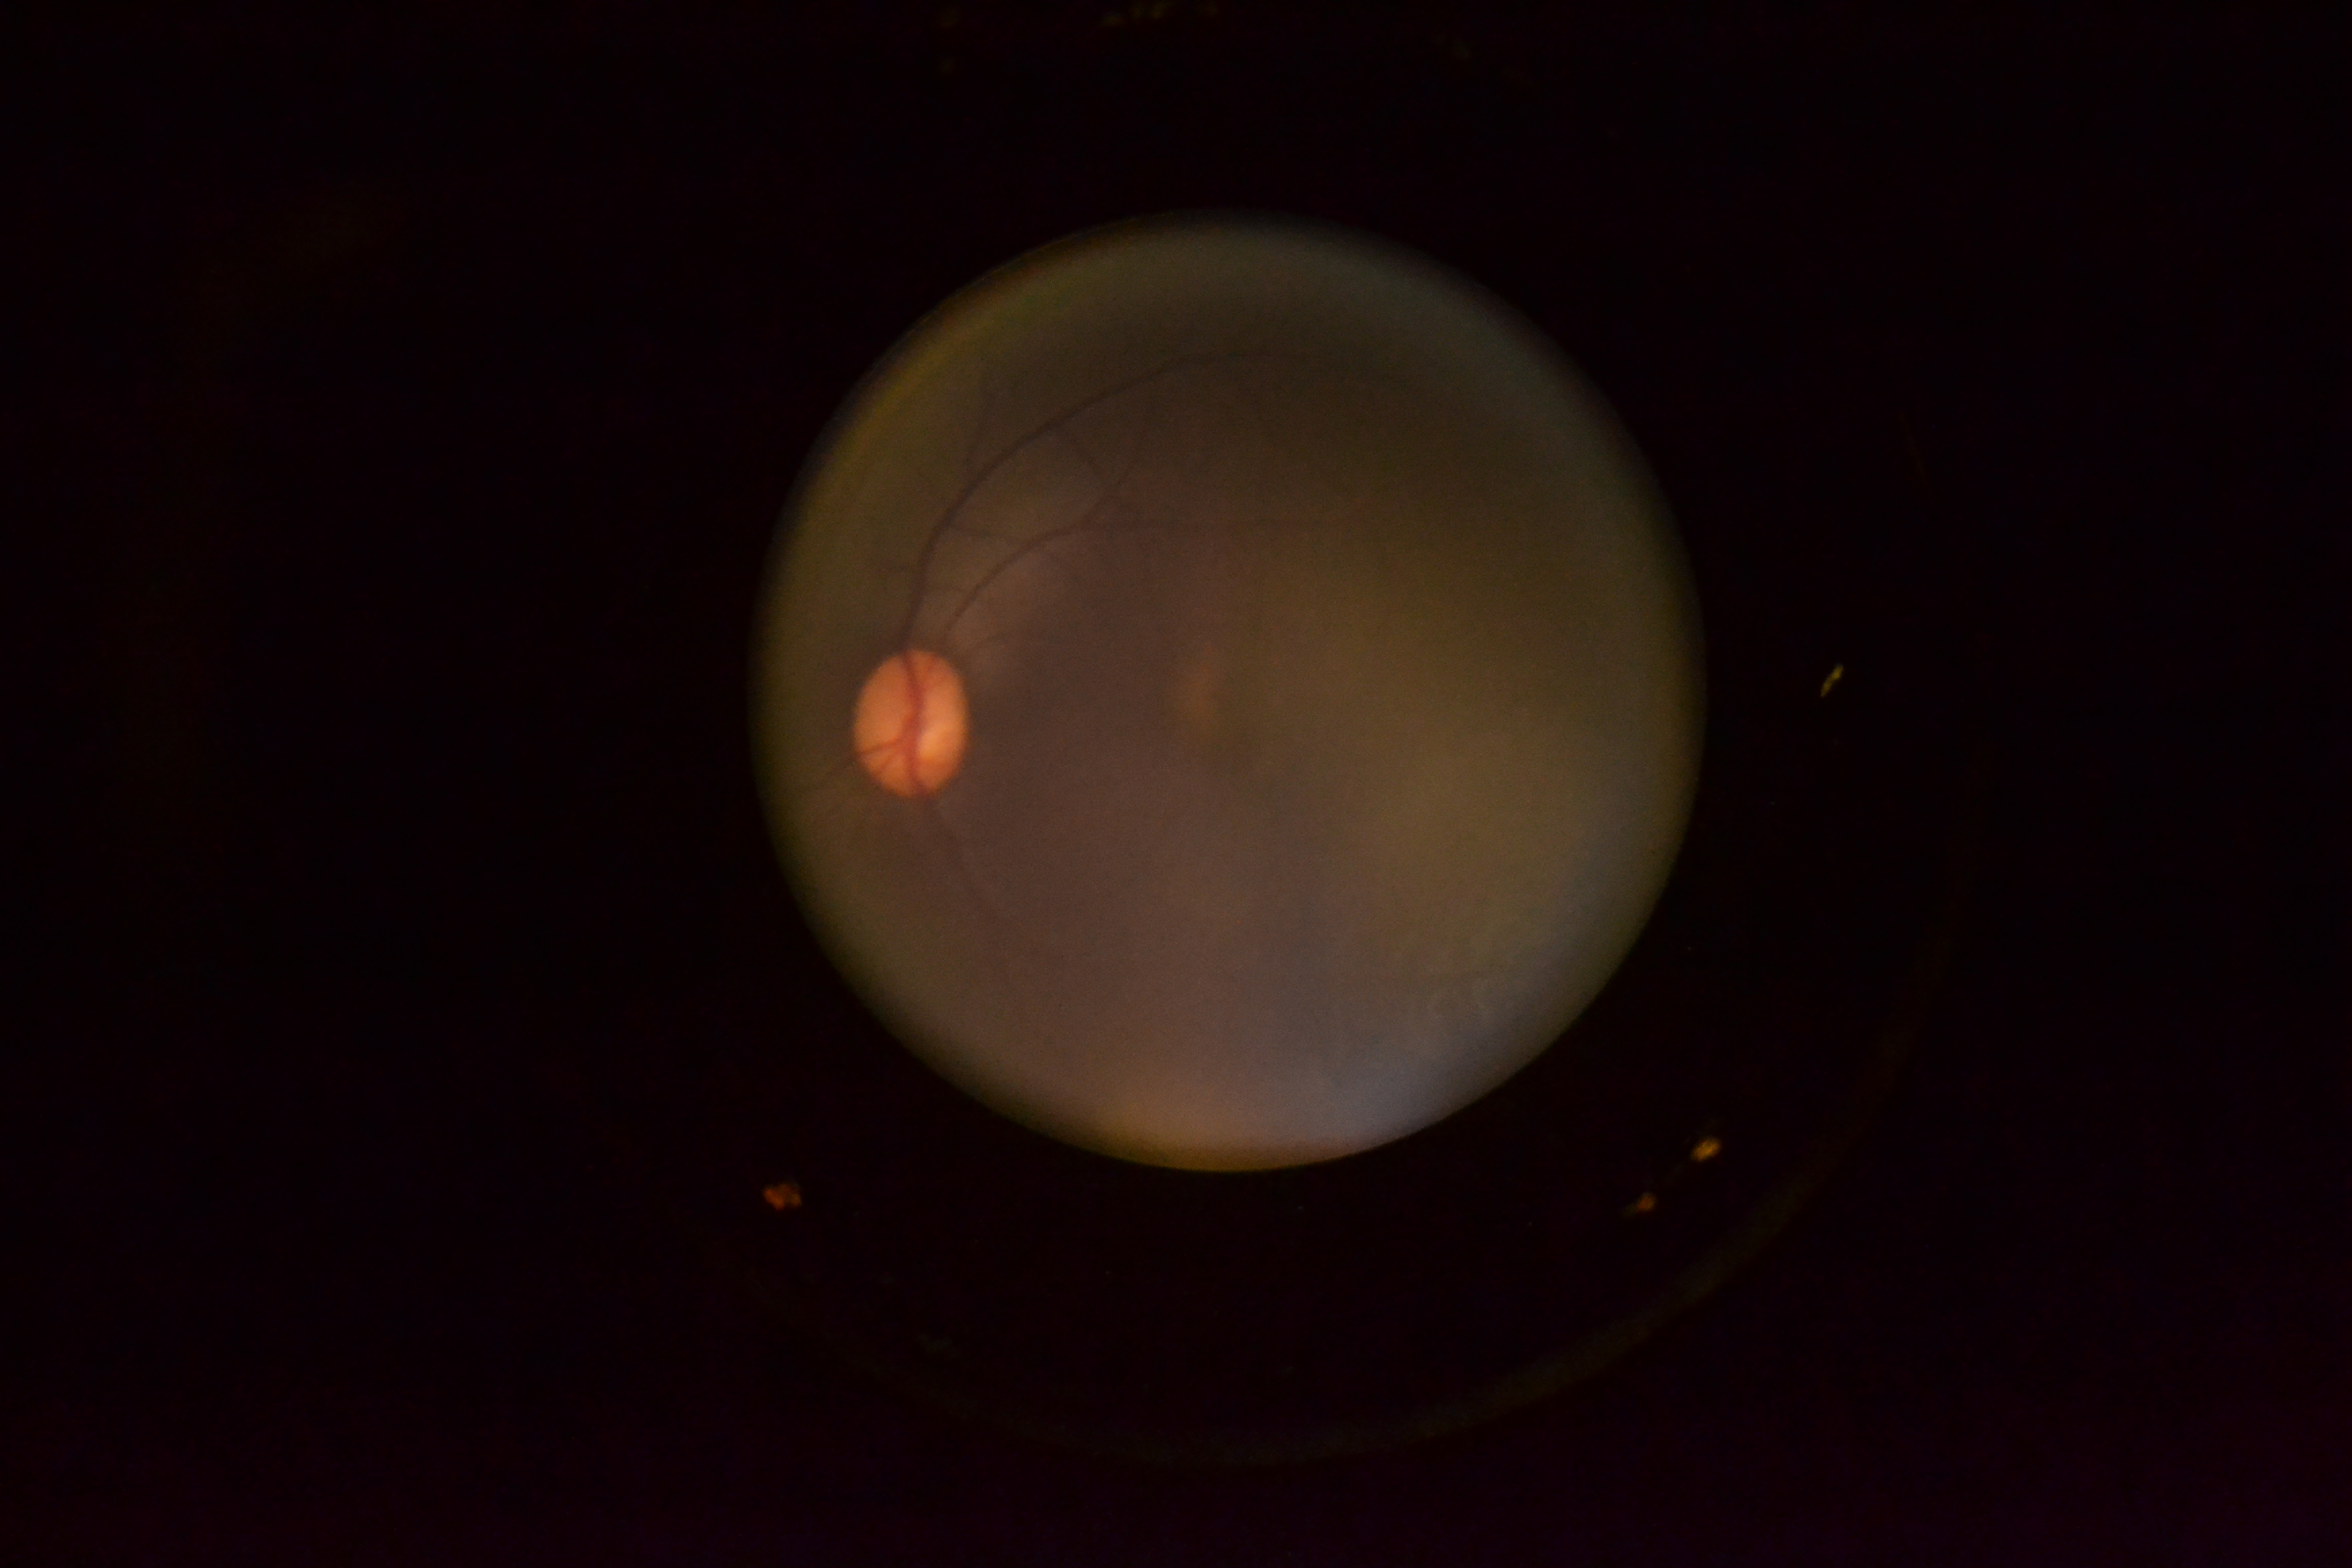
Full color image of a feline fundus showing optic nerve and blood vessels, taken with a custom designed animal eye imaging probe fitted with an onboard 10 MP color camera. Cross section is shown below.
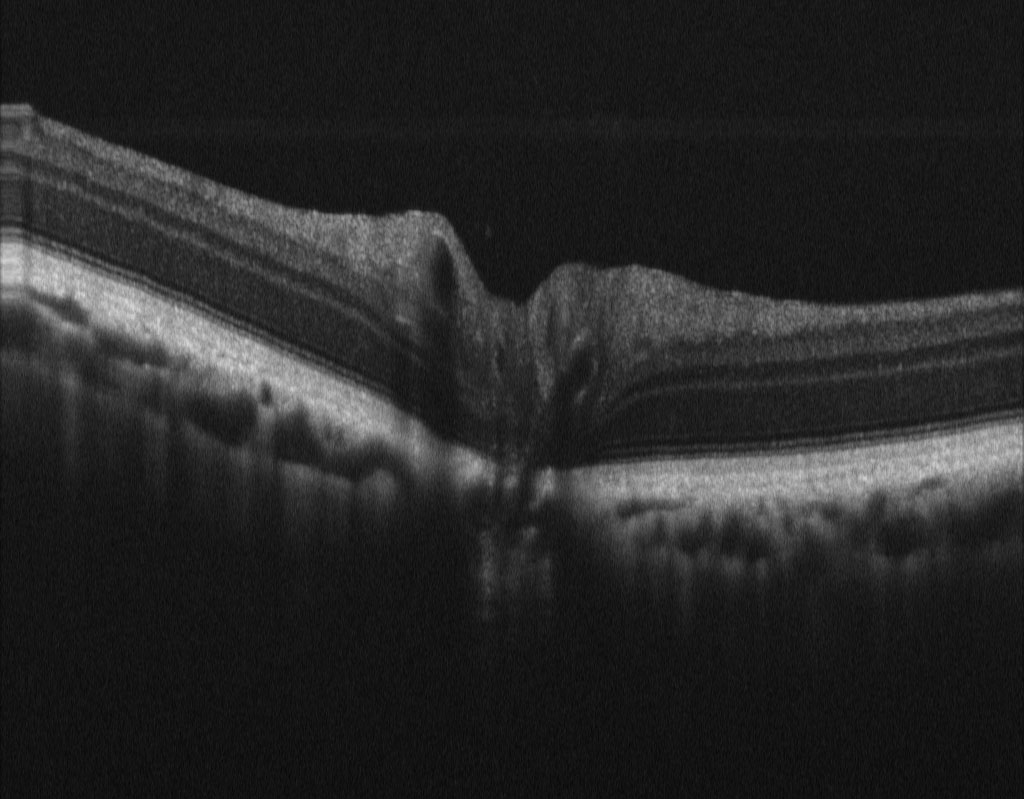
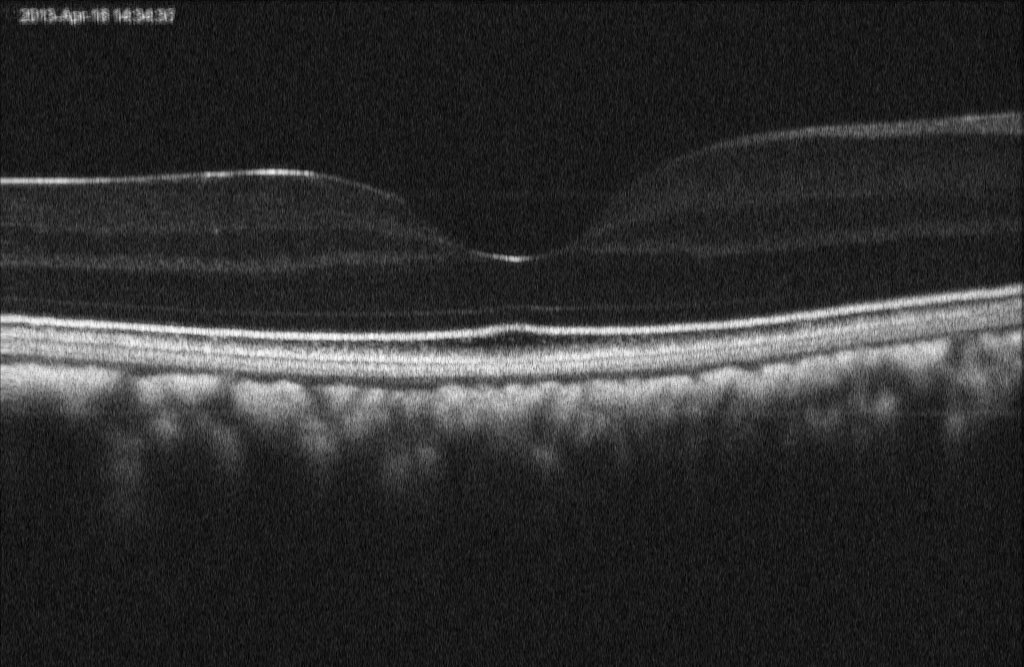
Cross-section OCT image of the feline retina shown above, clearly imaging different retinal layers, starting from nerve fiber layer down to choroidal blood vessels. The image was acquired using an 800 nm system based on a Cobra 800 OCT spectrometer at standard resolution using a custom designed animal eye imaging probe.
Full color image of a primate fundus (monkey) showing optic nerve and blood vessels, taken with a custom designed animal eye imaging probe fitted with an onboard 10 MP color camera. Cross section is shown below.
OCT cross-section image of the primate retina (monkey) shown above, imaging close to foveal region and clearly showing different retinal layers. The image was acquired using an 800 nm system based on a Cobra 800 OCT spectrometer at standard resolution using a custom designed animal eye imaging probe.
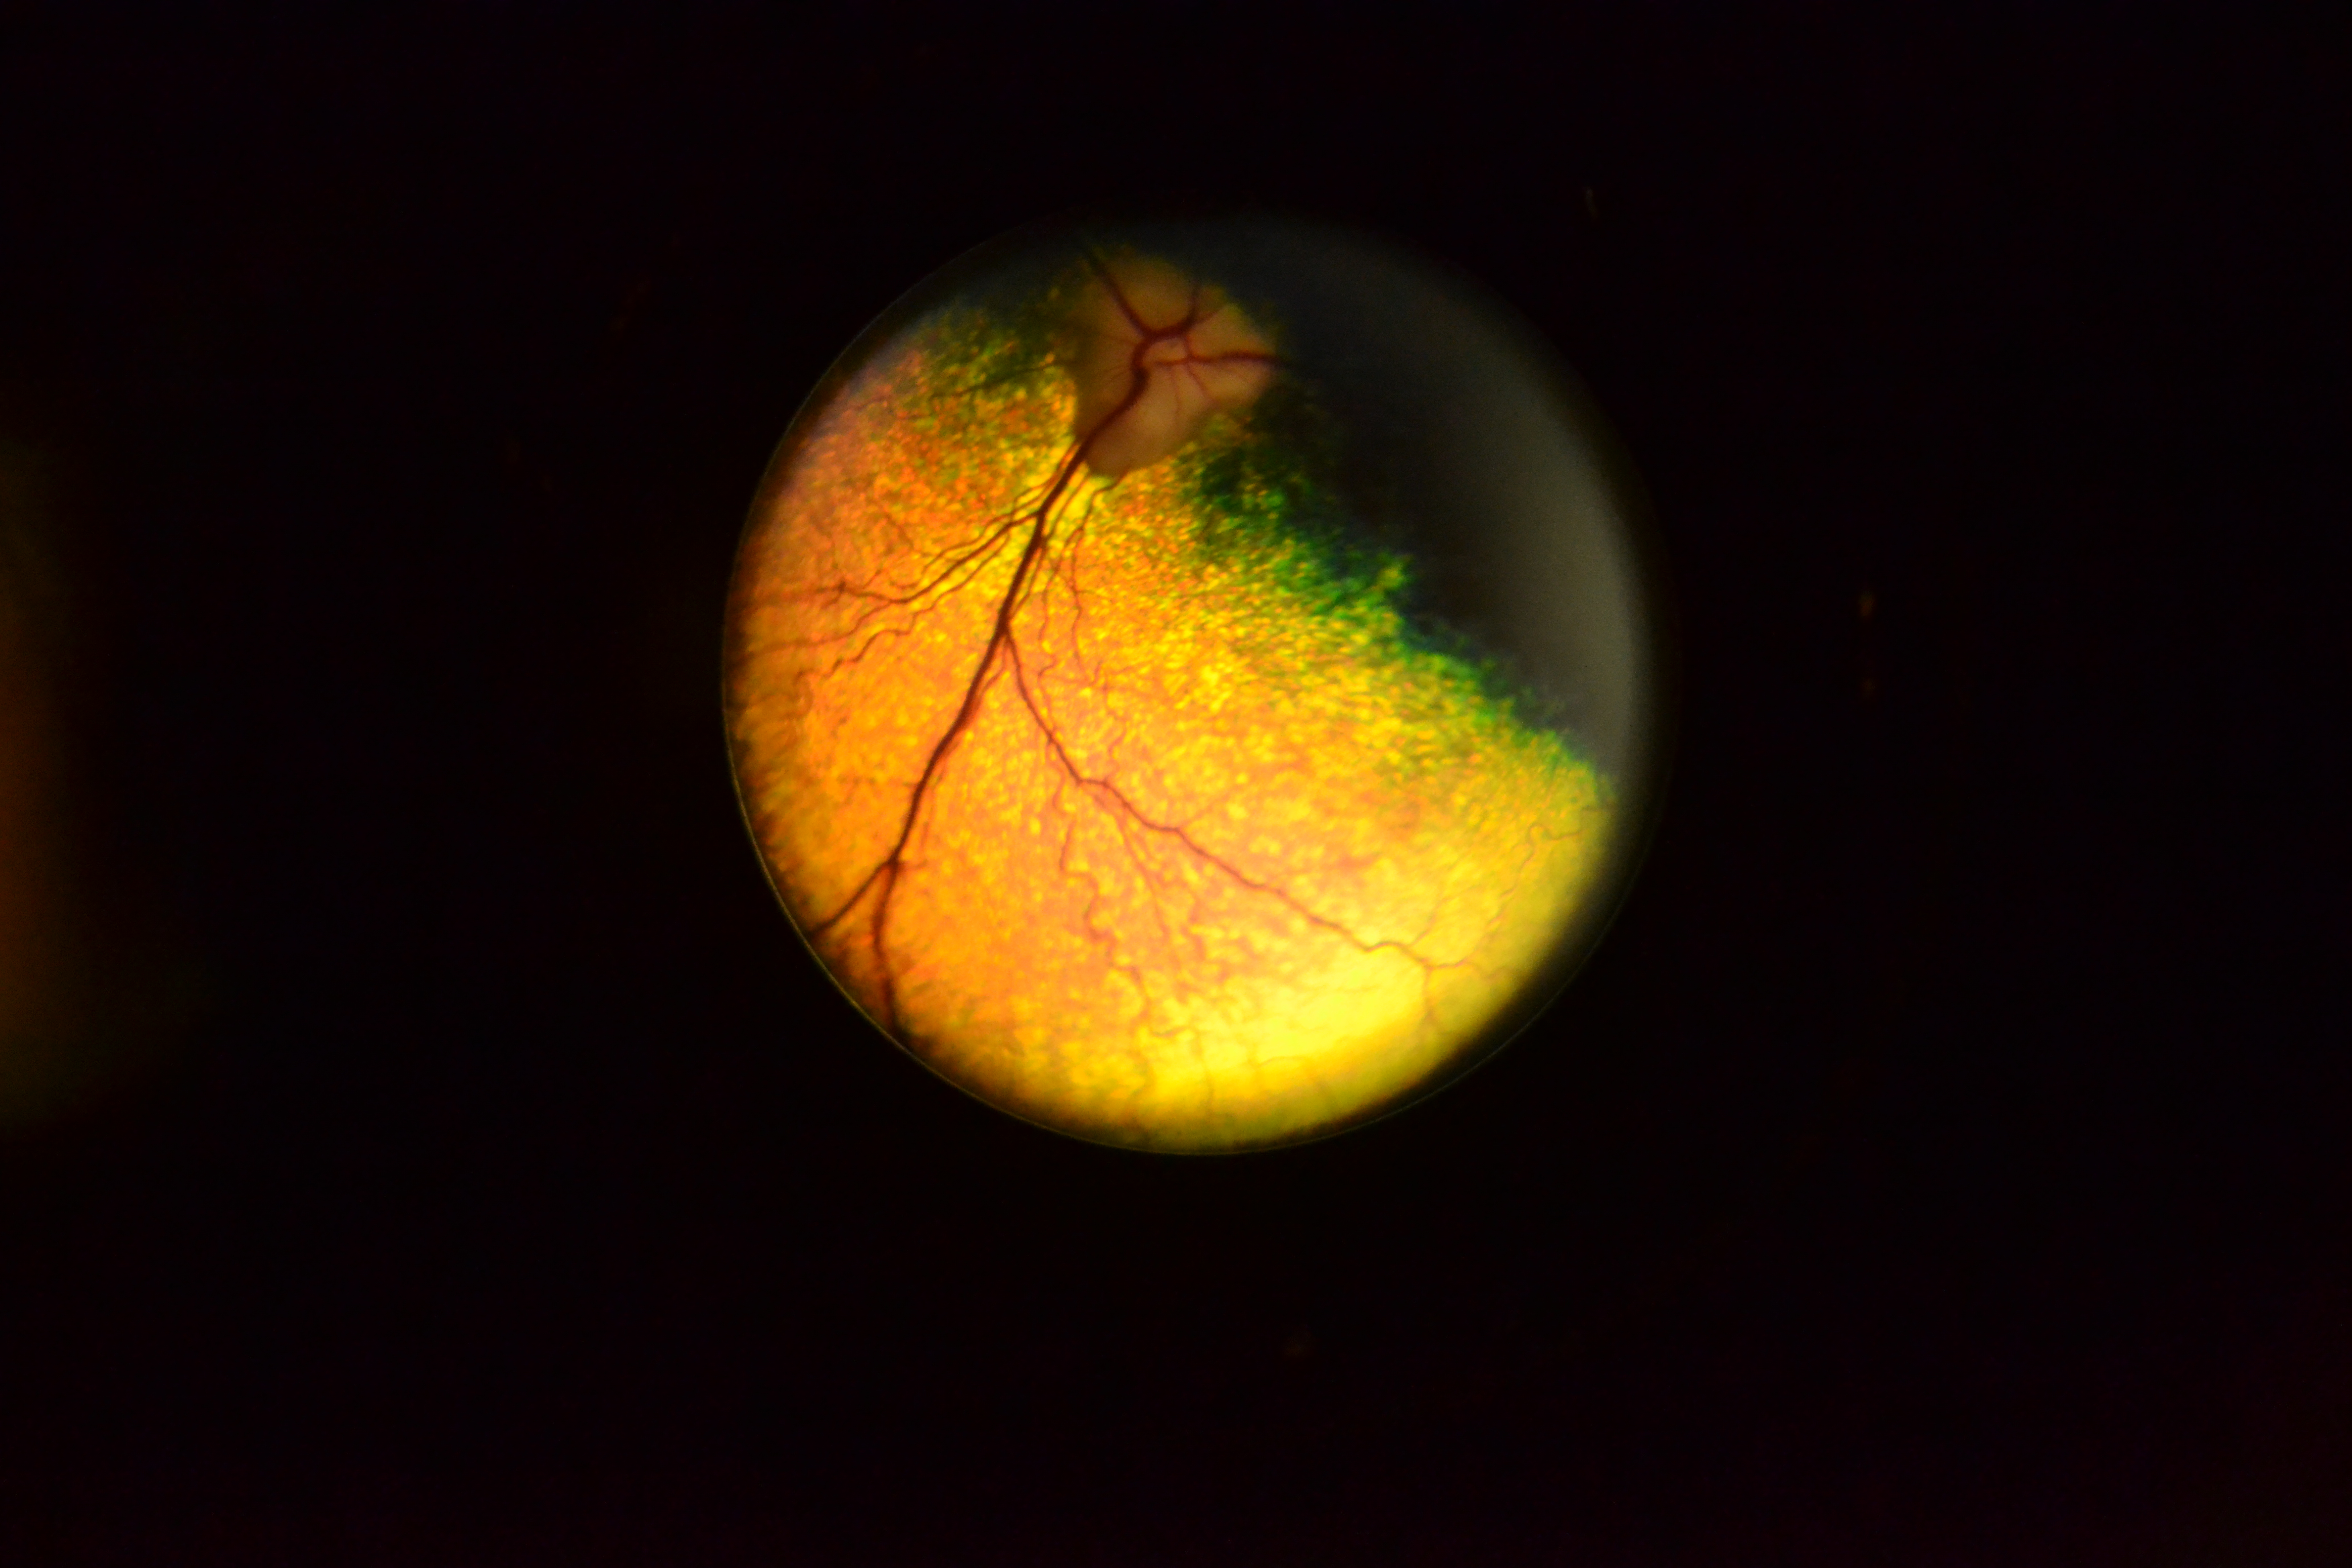
Full color image of a canine fundus showing optic nerve and blood vessels, taken with a custom designed animal eye imaging probe fitted with an onboard 10 MP color camera. Cross section is shown below.

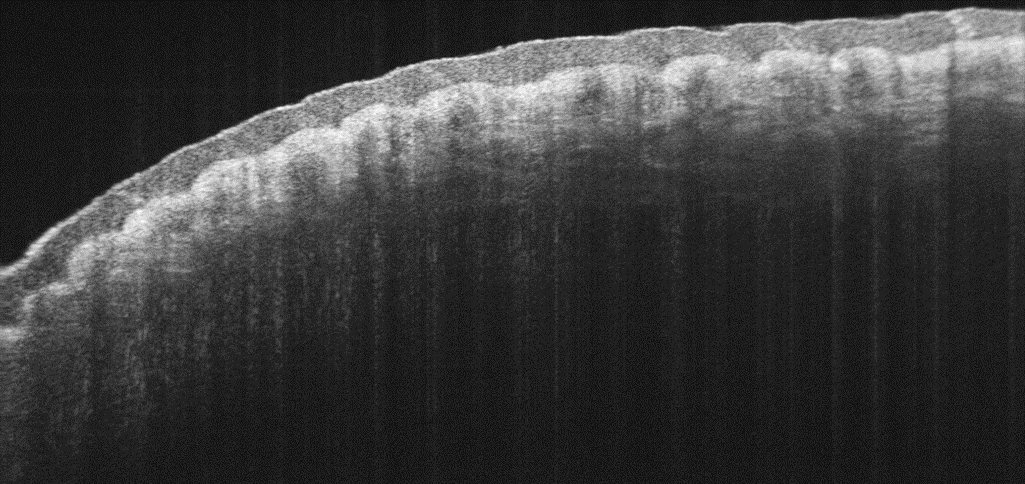
Posterior region of feline retina clearly showing different retinal layers. The high resolution of images captured with the Cobra 800 OCT spectrometer are ideal for study of retinal layers in veterinary specimens such as cats.
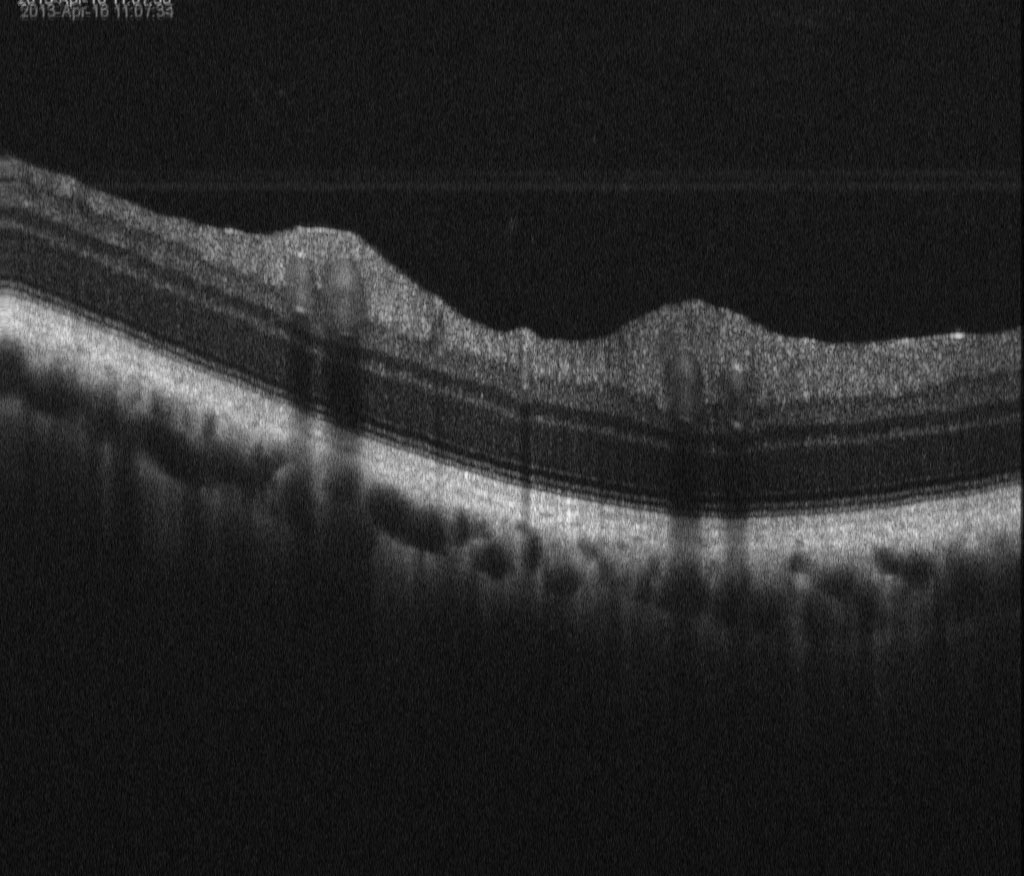
Cross-section OCT image of feline retina clearly showing different retinal layers, starting from nerve fiber layer down to choroidal blood vessels. The image was acquired using an 800 nm system based on a Cobra 800 OCT spectrometer at standard resolution using a custom designed animal eye imaging probe.
Cross-section OCT image of feline retina clearly showing different retinal layers, starting from nerve fiber layer down to choroidal blood vessels. The image was acquired using an 800 nm system based on a Cobra 800 OCT spectrometer at standard resolution using a custom designed animal eye imaging probe.
OCT cross-section image of monkey retina close to foveal region, clearly showing different retinal layers. The image was acquired using an 800 nm system based on a Cobra 800 OCT spectrometer at standard resolution using a custom designed animal eye imaging probe.
Cross-section OCT image of mouse retina showing different layers. The image was acquired using 800 nm OCT imaging.
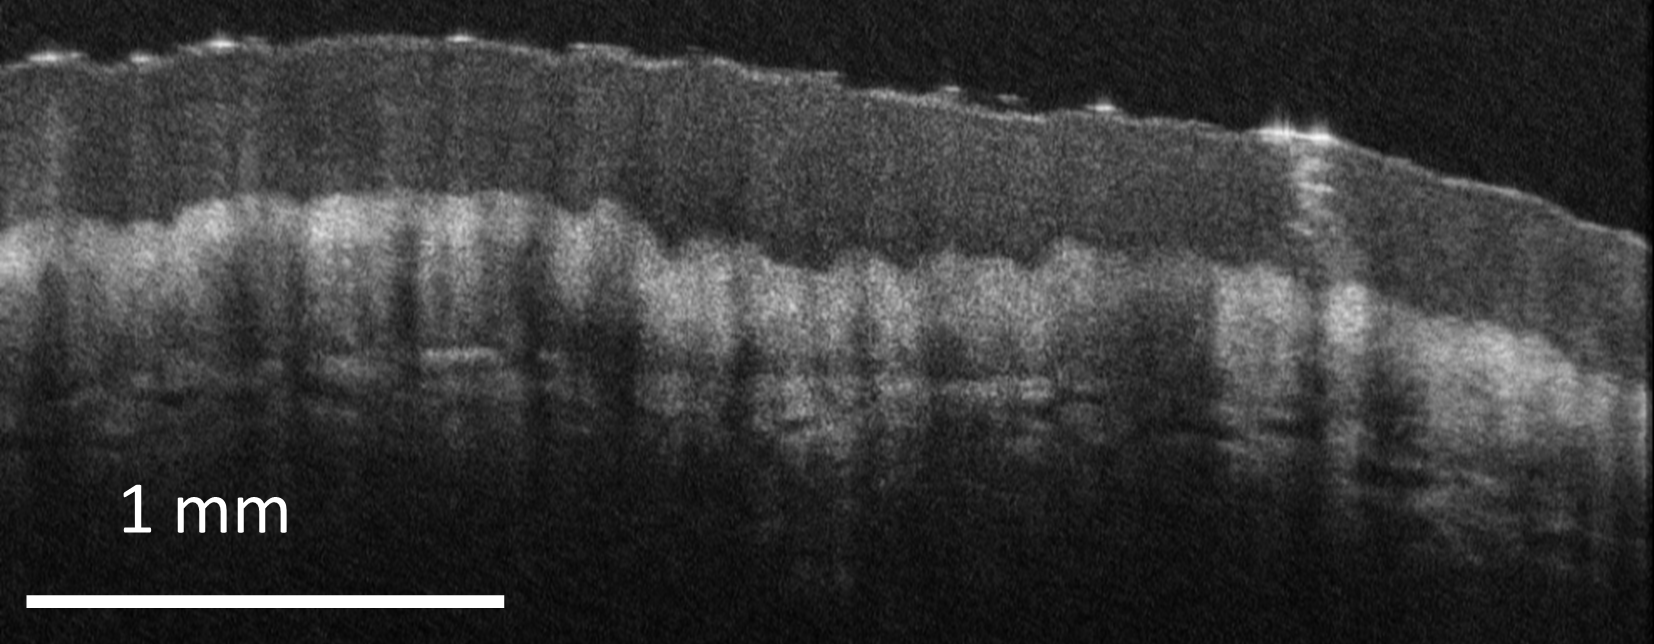
High-resolution mouse retinal image clearly showing different retinal layers, taken using a a high resolution Cobra 800 OCT spectrometer model. Mice are the most commonly studied animals in medical and scientific research, as they have a retinal structure similar to humans and can easily be genetically modified. Mice subjects are often used to study macular degeneration and other diseases, both as regards mechanism and response to pharmaceutical-based or laser treatment.
OCT angiography image of mice retina shows both large and micro-vessels at different depth locations using intrinsic contrast only. The false color in the image encodes the depth location of the blood vessels. Image taken with 800 nm system using a Cobra 800 spectrometer. The vasculature contrast was generated using OCT angiography.

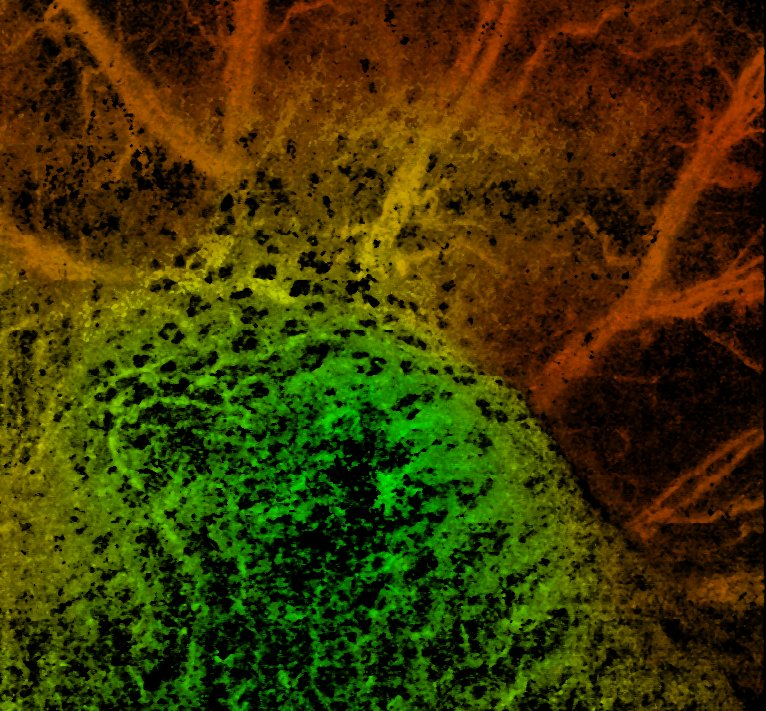
OCT angiography (OCTA) image of a full mouse ear taken with a Cobra 800 OCT spectrometer, showing a well-defined vascular pattern. This image demonstrates the high resolution that can be achieved with OCT angiography, which translates well to imaging vasculature of the skin.

The high resolution and low roll-off of the Cobra-S 800 OCT spectrometer is ideal for obtaining extremely detailed OCT angiography images.
Close-range OCT angiography image of a healthy mouse ear, taken with a Cobra 1300 OCT spectrometer. The image below shows the same ear post-tumor growth.
OCT angiography (OCTA) image of a diseased mouse ear, taken with a Cobra 1300 OCT spectrometer. In this case, a tumor was implanted in the mouse ear to demonstrate the ability of OCT angiography to distinguish tumor margins. This technique is of particular interest in cancer and carcinoma treatment. It can also be applied in endocrinological diseases like diabetes, in which there is a need to study perfusion in the body.

The high resolution and low roll-off of the Cobra-S 800 OCT spectrometer is ideal for obtaining extremely detailed images of the dermis.
Nail fold of human finger taken using a Cobra 1300 OCT spectrometer showing different layers of the skin and nail.

Cross-section image of a outside of human index finger taken using a Cobra 1300 OCT spectrometer showing different layers of skin.
Cross-section image of inside of human middle finger taken using a Cobra 1300 OCT spectrometer showing different layers of skin.
Cross-section image of outside of human middle finger taken using a Cobra 1300 OCT spectrometer showing different layers of skin.
Cross-section image of finger taken with a Cobra 800 OCT spectrometer, showing different layers below the skin and sweat gland as helical bright structure.
Cross-section of human nail edge of the finger, taken using a high resolution Cobra 800 OCT spectrometer.
Manufacturing: OCT is an excellent tool for evaluation of shapes and dimensions of tools, molds, and final parts, as shown here for polymer-based 3D printing. It can also provide real-time process feedback for control of ablation depth during laser machining, and for defect detection and dimensional analysis in additive manufacturing.
Aviation and Automotive: OCT can be used to evaluate application of critical coatings and paints in industries like aviation and automotive. High resolution layer imaging enables analysis of thickness uniformity and defects that can impact quality and safety, as shown in this detailed image of a multilayer paint coating.
Displays and Panels: The excellent axial resolution of OCT is ideal for imaging the multilayered structures used in display panels. The 3D information acquired can be used to evaluate flatness uniformity and identify subsurface defects affecting display quality. Sublayers < 10 µm in thickness can be clearly imaged, as shown here.
Medical Devices: The medical industry has been quick to adopt OCT for the analysis of high precision medical devices due to its ability to generate non-contact images of very small, thin, and delicate structures such as this contact lens. OCT can also provides information about pores, defects, and gaps in the production of critical membranes and seals.
Corrective Lenses: This high-resolution image of a contact lens edge taken with a Cobra 800 OCT spectrometer shows the potential of OCT for material inspection. Contact lens edges are a feature of interest because comfort of a contact lens depends on how the lens contacts the cornea. No adequate non-destructive method exists for evaluation except OCT.
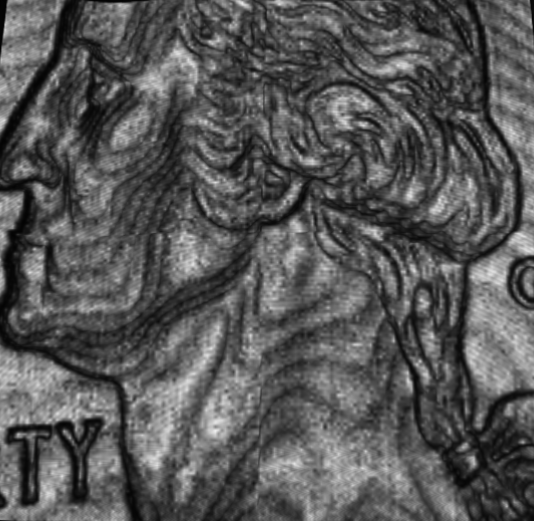
Currency: A wide field image of US quarter. The image shows unique capability to acquire multiple OCT sections in a single shot. The image was acquired using 840 nm OCT imaging.
Commercial Goods: High-resolution OCT images of commercial goods can be used for quality control, as shown in this image penetrating multiple layers of standard adhesive tape. The image was acquired using a high-resolution Cobra 800 OCT spectrometer.
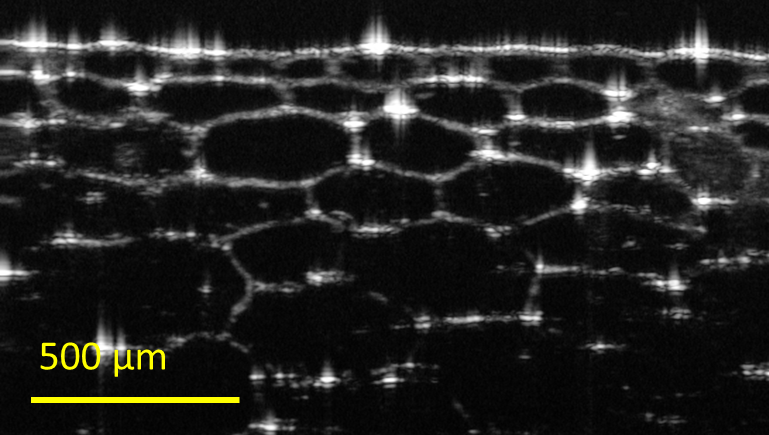
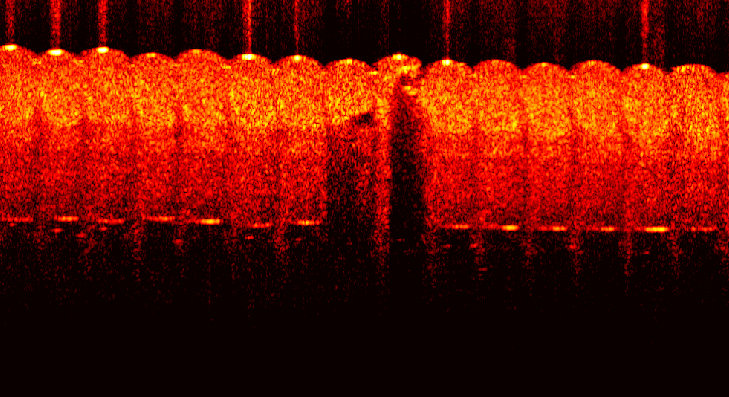
Plant Tissues: Even plant tissues can be imaged non-destructively with OCT, as shown in this cross-section of an onion skin showing cells at different depths. The image was acquired using a high-resolution Cobra 800 OCT spectrometer.
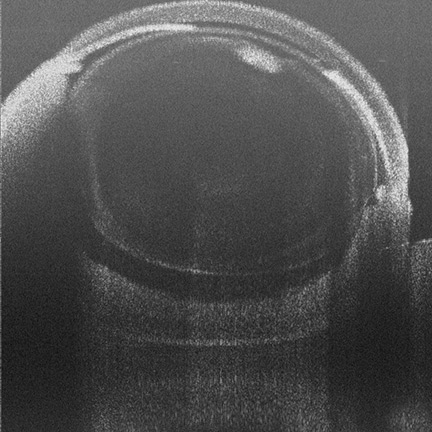
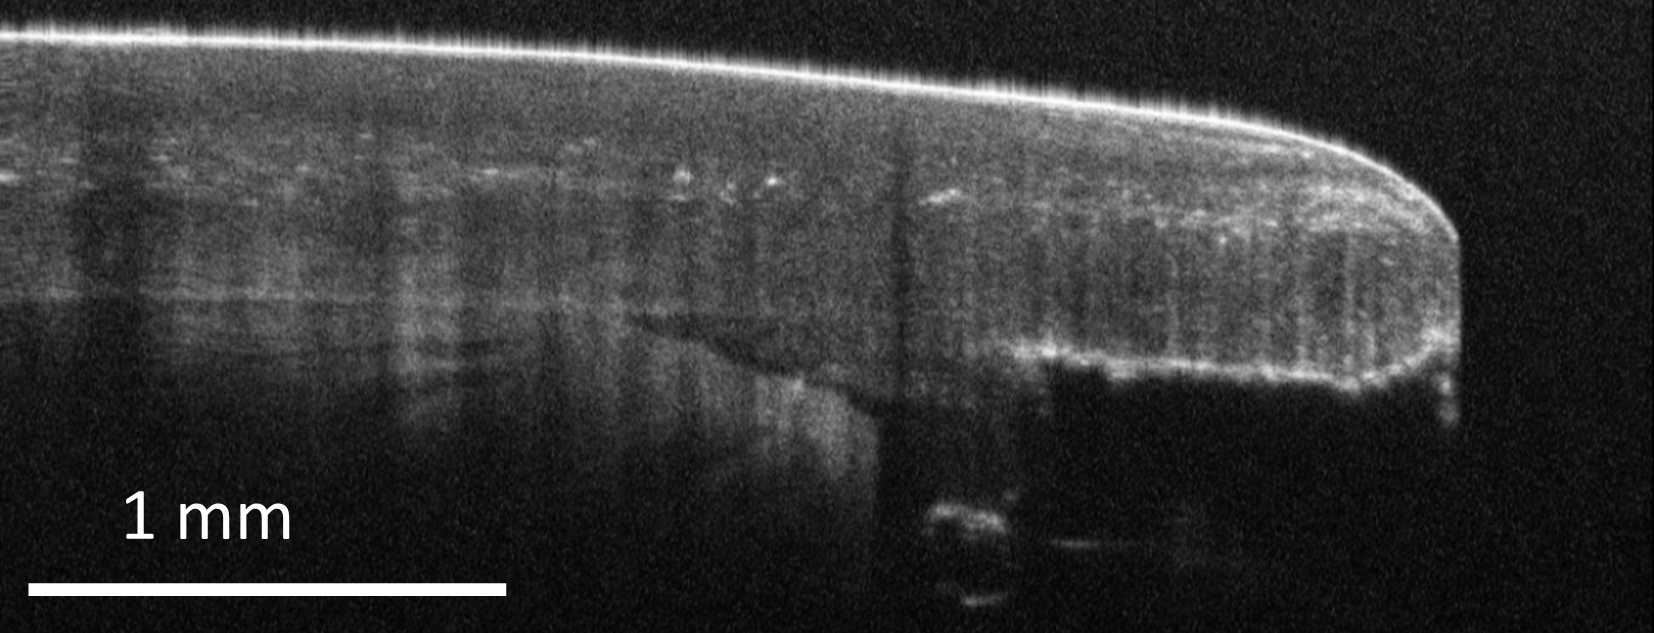
Wide Field Imaging: OCT can even be used to capture an image of a whole mouse eye to show different structures and total length for myopia studies, as shown here using the Cobra 1300 OCT spectrometer. This specialized application offers medical research a non-destructive method of wide field imaging.
