OCTA Tutorial: How does OCT Angiography Work?
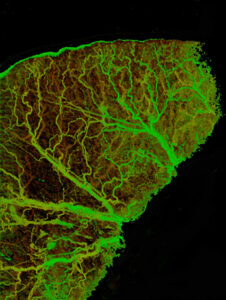
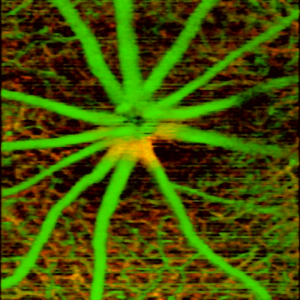
OCTA, also known as OCT angiography, is a non-invasive and dye-free imaging technique that can be used to visualize blood flow in tissues in 3D. It is a variant of optical coherence tomography (OCT), an optical imaging modality first applied in ophthalmology. OCT uses the light scattered from different depths within tissue to build up an image of the tissue’s structure in cross-section. These images can be combined to create a 3D image of the tissue structure at depths up to several millimeters. In OCTA, sequential scans are compared in software to detect local fluctuations in signal due to the motion associated with blood flow. OCTA allows volumetric angiography images to be captured in a matter of seconds, providing concurrent information about tissue structure and blood flow for research and diagnostic purposes.
In this OCTA tutorial, we give a quick overview of OCT angiography – its emergence, advantages, and the technology. We also explore different methods employed in OCTA, as well as choice of scan pattern.

OCT angiography (OCTA) refers to a class of medical imaging techniques that allows visualization of blood vessels in a living tissue. In general, angiography is performed by varying a standard medical imaging technique to provide contrast for the blood vessels. The goal of any angiography technique is to distinguish the blood vessel network from the rest of the tissue. Several techniques such as X-ray fluoroscopy use contrast agents that pass through the blood stream after oral or intravascular injection. Angiography in the eye commonly uses fluorescein or ICG dyes to provide the contrast. It involves injecting dye in the subject’s vein followed by imaging the retina using an appropriate camera.
Optical coherence tomography (OCT), introduced in the early 1990s, has come into its own as a medical imaging technique. The technique is widely used in ophthalmic diagnostics and has shown strong potential for several other applications. The technique offers several unique features that has made it highly effective for medical imaging applications. OCT provides resolution under 10 µm, generates a three-dimensional map of the structure, and can provide volumetric information in just a few seconds. Like other imaging modalities, variations of OCT have been developed that can provide contrast for blood vessels in particular. A major advantage of OCT based angiography is the lack of requirement for any additional contrast agent. Contrast agents can have undesirable side effects, may interfere with the normal biology of the subject, and thus make repeated imaging sessions more difficult.
OCTA brings all of the desirable features of optical coherence tomography to the filed of angiography. In particular, the vascular structure can be mapped at a high enough resolution to visualize the micro vessels. Additionally, the vessels can be mapped in three dimensions and correlated with tissue structure. OCT is widely used in ophthalmology and hence the first applications of OCT angiography are being found in this field. However, there are also several applications for OCT angiography in life-sciences, oncology, dermatology, and endocrinology. The addition of contrast specifically for angiography is expected to broaden the existing application domains for OCT.
How OCT Angiography Works

The goal of angiography is to distinguish the regions of the image that belong to the blood vessels from the rest of the tissue. This can be defined as a statistical estimation problem where each pixel in the image is associated with the probability of it belonging to a blood vessel. Such estimation is based on the signal properties that are significantly different between the blood vessels and rest of the tissue.
OCTA relies on this variation in the signal due to motion of the particles such as red blood cells in the vessels to distinguish them from the rest of the sample being imaged. The temporal OCT signal properties therefore differ in the regions with moving particles vs the static regions of the tissue. Application of this concept in practice requires several considerations: 1) The signal properties and optimal means of analyzing them for variation over time, 2) The time differences at which the signal should be measured to study the dynamics, and 3) Accounting for the signal changes resulting from factors other than motion in blood vessels, such as bulk motion of the sample and noise/inaccuracies in the measurement of the signal.
The Signal: Intensity and Phase
The signal obtained from optical coherence tomography contains two types of localized information, first being the intensity of the light reflected by that point within the sample and second, the change in phase of the light wave. The reflected intensity depends on the local heterogeneity, or the refractive index gradient of the region being probed, while the phase itself is arbitrary. A change in phase over time results from the motion of the scattering particles in the direction of travel of light. When the sample is completely stationary, variation in the intensity and phase of the reflected signal is only a result of intrinsic signal noise. The motion of the red blood cells in the blood vessel results in a change in phase and intensity of the signal over time. By quantifying this variation, we can estimate the probability of a particular pixel in the image belonging to a blood vessel.
There are several methods for creating an angiographic map from OCT images. These methods may use only the phase, or the intensity, or a combination of both. In regards to the ‘phase only’ methods, techniques based on Doppler shift are the most common. These techniques measure the change in phase over time at a given location. The motion of a scattering particle away or towards the imaging beam results in a frequency shift or phase change. This method is sensitive to small displacements (on the order of the wavelength of light) and hence is useful in measuring the slow movements of cells in smaller vessels. However it has a couple of major drawbacks. The phase change method is only sensitive to the motion along the direction of the beam and hence is not suitable for vessels which are nearly perpendicular to the beam. The sensitivity of the technique to small changes also makes it more susceptible to bulk motion of the tissue and noise in the system.
The simplest method that only uses the intensity component of the signal is called speckle variance. An OCT intensity image has an inherent speckle nature to it, hence the word speckle. This technique estimates statistical variance of the signal intensity from the same location at different points in time. The calculated variance is normalized with respect to the intensity of the image in the region. The region of the image with moving scatterers has relatively higher variation over time compared to the regions with static tissue. This technique is more robust to small displacements in the sample, however by not using the phase information, the technique can be less sensitive to slow moving scatterers.
In addition, there are techniques that utilize changes in both the intensity and the phase at the same time. One such technique uses the concept of complex differential variance, where the changes in both the intensity and phase over time are quantified. The variance is calculated with a weighted average along the axial direction. This reduces the sensitivity of this method, unlike the Doppler shift technique, to small axial displacements. This approach to OCTA image analysis can combine the advantages of both phase and intensity based methods when appropriately applied.
Scan Patterns: All about the timing
In OCTA, an angiographic map is created based on changes in intensity and/or phase over time. This necessitates measuring the OCT signal at the same location multiple times. The regular raster scan method hence is not suitable for OCT angiography, as this method only samples each point at one instant in time, and does not carry any information about temporal variation in the signal.
Different scan patterns have been adopted to obtain the temporal dynamics of the signal. A key factor in choice of a scan pattern is the time difference between the measurements at the same location. If the measurements are too close in time, the changes from smaller vessels with slow moving red blood cells will not be detected. When the measurements are too far apart, the signal might change in the non-vessel regions due to sample movement or environmental changes.
The correct scanning pattern choice depends on the sample of interest. In the case of imaging the eye, a longer time difference will not be suitable due the limited ability of patients to fixate. In such cases additional motion correction methods are needed to compensate for sample instability. On the other hand, OCTA on a mechanically stable sample can be done via scan patterns that probe the sample at longer time differences. Such patterns provide the best chance of visualizing microvasculature in great detail.
Angiographic imaging can also utilize patterns that are not just variations of standard raster scans. A common method utilizes a spiral scanning pattern. Such a pattern eliminates the flyback time that is associated with the common raster scan patterns, allowing faster resampling of the sample of interest.
Bringing OCTA into your lab
OCT angiography is a powerful technique for noninvasive imaging of vascular structure and blood flow, with applications across a wide range of medical research and diagnostics. Wasatch Photonics offers industry-leading OCT gratings and high-speed OCT spectrometers for both research and OEM use to support this technique. Explore our products below:
- OCT gratings: Broadband, high efficiency transmission gratings, available online or via custom order
- OCT spectrometers: Low roll-off designs based on proprietary optics maximize sensitivity and SNR for clearer images, with over a dozen standard models for visible and 800 nm OCT with 250 kHz scan rates
Contact us today with your specific needs or to receive a quote!
Wasatch Photonics in the OCTA Literature
- Cobra-S 800 OCT spectrometer: Camino, Acner, et al. “Sensorless adaptive-optics optical coherence tomographic angiography.” Biomedical Optics Express 11.7 (2020): 3952-3967.
- Cobra 1300 OCT spectrometer: Marchand, Paul J., et al. “Validation of red blood cell flux and velocity estimations based on optical coherence tomography intensity fluctuations.” Scientific reports 10.1 (2020): 1-10.
- Cobra 1300 OCT spectrometer: Vasudevan, Srikanth, et al. “Toward optical coherence tomography angiography-based biomarkers to assess the safety of peripheral nerve electrostimulation.” Journal of neural engineering 16.3 (2019): 036024.
- OCT grating, 2400 lpmm: Song, Weiye, et al. “Visible light optical coherence tomography angiography (vis-OCTA) facilitates local microvascular oximetry in the human retina.” Biomedical Optics Express 11.7 (2020): 4037-4051.
- OCT grating, 1800 lpmm @ 840 nm: Wang, Tai-Ang, et al. “Ultrahigh-resolution optical coherence tomography/angiography with an economic and compact supercontinuum laser.” Biomedical optics express 10.11 (2019): 5687-5702.
- OCT grating, 1200 lpmm: Son, Taeyoon, et al. “Functional optical coherence tomography of neurovascular coupling interactions in the retina.” Journal of biophotonics 11.12 (2018): e201800089.
- OCT grating, 1800 lpmm: Pi, Shaohua, et al. “Angiographic and structural imaging using high axial resolution fiber-based visible-light OCT.” Biomedical optics express 8.10 (2017): 4595-4608.
- OCT grating, 1200 lpmm: Winkelmann, James A., et al. “Spectral Contrast Optical Coherence Tomography Angiography Enables Single-Scan Vessel.” Opt. Express 3 (2012): 1914-23.


