Colloidal SERS meets dry substrate for convenient, reproducible results
Surface enhanced Raman spectroscopy (SERS), first discovered in the 1970’s, has long offered the promise of sensitive detection of trace analytes using Raman spectroscopy. In practice, however, no SERS approach has found quite the right balance between reproducibility, cost, ease of use, and scalability. In this application note, we present and test a new generation of SERS substrates which show promise to combine the convenience of SERS substrates with the reproducibility of SERS performed in solution. Developed by Nikalyte, these SERS substrates employ a hybrid approach – a quartz fiber pad coated with gold nanoparticles to which a liquid analyte can be applied. To assess their performance, we used Wasatch Photonics’ compact Raman systems at two different wavelengths, 785 nm and 830 nm, measuring a concentration series of caffeine in water from 1% down to 1 ppm. The result? The Nikalyte SERS substrates enabled detection of significantly lower concentrations, independent of the laser wavelength, yielding Raman signals for the main peaks of the analyte even at the lowest tested concentration of 1 ppm.
Raman spectroscopy is a powerful analytical technique, combining high selectivity, speed, and ease of use. However, Raman scattering is inherently a low-signal effect. Low concentration solutions are therefore a challenge for this spectroscopic technique. A proven signal enhancement method exists, however, which utilizes nanoscale metal structures to amplify the electric field of the laser tremendously. This technique is called Surface Enhanced Raman Spectroscopy, or SERS, and offers the potential to make trace detection and identification of materials using Raman a viable technique for use in the lab, the field, and the clinic.
Download the App NoteThe SERS Effect
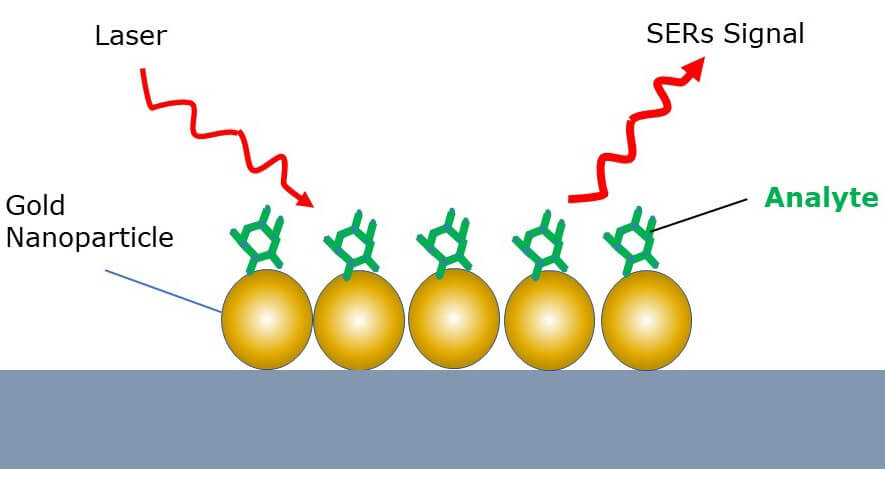
Surface enhanced Raman spectroscopy can be used to increase the strength of the Raman scattering effect by multiple orders of magnitude, thus enabling trace detection of materials with compact and cost-efficient Raman spectrometers for use in a diverse range of sensing applications. SERS is typically performed using noble metal nanoparticles or a solid nanostructured metal surface, and involves the analyte molecules being “captured” between the nanoparticles or adsorbed on the metal surface. In this close proximity, surface plasmon resonance in the noble metal generates an amplified electromagnetic field that enhances the Raman signal and facilitates detection of analytes with very low concentrations.
SERS in Solution
One common approach to SERS uses colloidal gold nanoparticles (AuNPs) in aqueous solution, which are combined with the analyte of interest, and then agglomerated with the addition of a small amount of hydrogen chloride. The analyte is trapped between some of the nanoparticles, where it experiences a local amplification of the laser’s electromagnetic field due to the SERS effect. This SERS approach yields reproducible signals, but the handling with solutions is troublesome, and is not conducive to field use by non-experts.
Wet-deposited SERS Substrates
A more convenient approach deposits the nanoparticle clusters on a solid substrate, such as an absorbent pad mounted to a microscope slide. The analyte solution is added to the pad on the substrate and the analyte diffuses into cavities between the nanoparticles, where the SERS effect amplifies the Raman signal. Typically, the nanoparticles are deposited from an aqueous solution and dried. Wet-deposited SERS substrates, however, often display significant spatial inhomogeneities, resulting in low signal reproducibility.
Dry-deposited SERS Substrates
As an alternative, the nanoparticles on the SERS substrates in the present test have been deposited in a low-pressure solvent-free gas-phase process, yielding far more homogeneous coverage. After addition of the analyte solution, these loosely attached nanoparticles agglomerate on the substrate pad around the analyte. These new SERS substrates therefore combine the convenience of SERS substrates with the reproducibility of the solution SERS approach.
![]() Nikalyte SERS substrates utilize gold nanoparticles generated in vacuum, which are ultra-pure and free of hydrocarbons. As no chemicals are used in the synthesis of the nanoparticles, the SERS substrates are free of contamination, delivering superior sensitivity and specificity. Learn more
Nikalyte SERS substrates utilize gold nanoparticles generated in vacuum, which are ultra-pure and free of hydrocarbons. As no chemicals are used in the synthesis of the nanoparticles, the SERS substrates are free of contamination, delivering superior sensitivity and specificity. Learn more
Experimental Setup
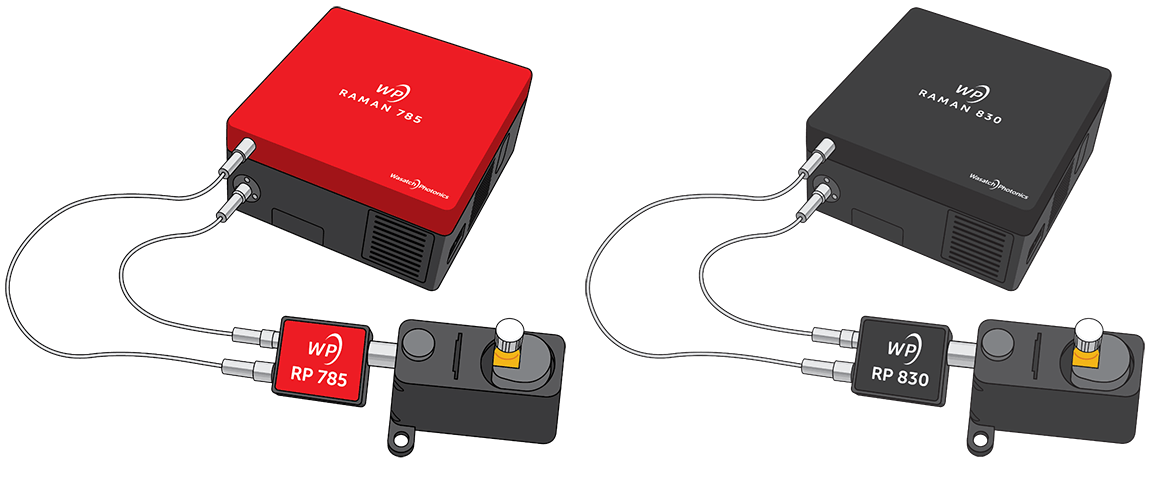
Testing of the Nikalyte SERS substrates was performed using two different wavelengths of Wasatch Photonics Raman systems designed with an integrated laser (WP-785-SR-25 and WP-830-SR-50) and connected to a matched, fiber-coupled Raman probe. As a whole, these semi-integrated Raman systems offer high sensitivity in a compact, cost-effective footprint, while retaining the flexibility of a modular system via the use of a discrete Raman probe. Additionally, Wasatch Photonics Raman spectrometers are provided with an intensity correction calibration via a standard reference material (SRM) to ensure reproducible measurements, also facilitating comparison against spectra taken with other intensity-calibrated Raman instruments, and allowing library matching for material identification.
Both 785 nm and 830 nm Raman measurements were made to compare the signal seen and assess possible fluorescence background. Fluorescence is a common problem in Raman measurements of organic substances, and thus the versatility to use the Nikalyte SERS substrates in conjunction with a compact Raman system offered at multiple wavelengths significantly expands the range of possible applications.
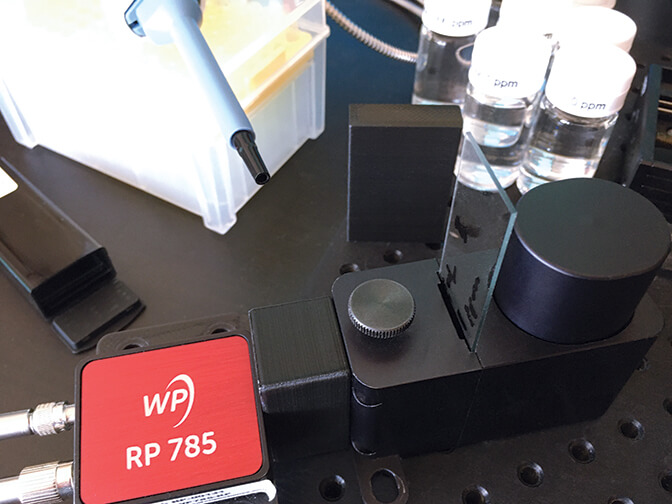
In both cases the probe was inserted into a standard Wasatch Photonics Raman sample holder, which includes a slot to accommodate a microscope slide oriented vertically. The probe was first passed through a 22 mm spacer to optimize the distance between the probe tip and the SERS substrate for reproducible focusing conditions.
For this experiment, a laser fiber with a larger core diameter was chosen to increase the spot size on the substrate from the approximately 170 μm diameter that would be achieved with a typical 105 μm FC fiber, to about 900 μm with this larger 550 μm core diameter laser fiber.
In a separate power dependence experiment, we determined a maximum allowed power of 100 mW in this approximately 900 μm diameter spot as the onset of saturation or substrate damage. A laser power of just 80 mW was used throughout this experiment to avoid any possible saturation or substrate damage.
SERS Sampling Procedure
The sample preparation procedure recommended by Nikalyte, manufacturer of the SERS substrates, was followed:
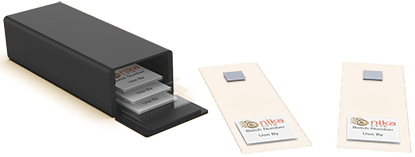
- Remove glass slide from the carrier without touching the active area to avoid contamination.
- Do not wash the substrate or expose to ultrasound.
- Carefully inject 15 μL of analyte solution onto one corner of the active area of the substrate and allow to spread across the whole square. Do not dip the substrate into the analyte.
- Wait for the active area to change color from pink to blue; this indicates it is ready for use.
- Measure the Raman signal immediately.
It is recommended by the manufacturer to use a laser power density of 15 W/cm2 (maximum 20 W/cm2). The chosen laser power at the given spot size for this experiment stayed within this limit.
The spectral measurement settings were chosen as 1000 ms integration time and 10 averages. To assess repeatability, five repeat spectra were acquired back-to-back at the same location. A second set of five repeat spectra was collected on the same substrate immediately thereafter, but at a slightly offset location.
Spectra were acquired for both the bulk solution in a vial and for the same solution added to a Nikalyte SERS substrate, both measured with the same setup to allow comparison of the signal.
Preparation of Solutions
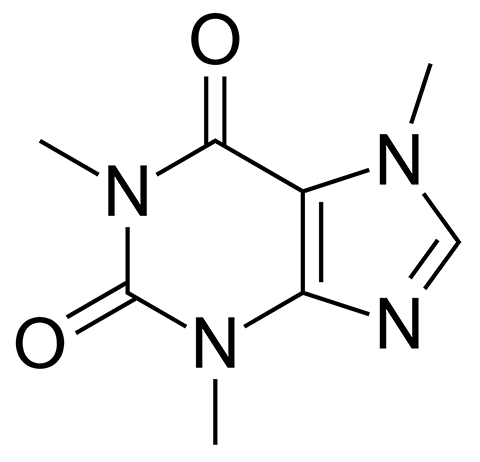
Trace identification of drugs is a common application area for SERS, and thus caffeine was chosen as a readily available stand-in analyte for a typical drug molecule. Caffeine does not benefit from specific interaction with gold nanoparticles and thus constitutes a representative test molecule.
For this test, a dilution series of caffeine in water was prepared, starting with a solution of 1.000 g caffeine dissolved into 100.0 mL of solution for a concentration of 1%, which was then diluted in serial 10x dilutions using analytical glassware down to a concentration of 1 ppm.
Spectral Analysis
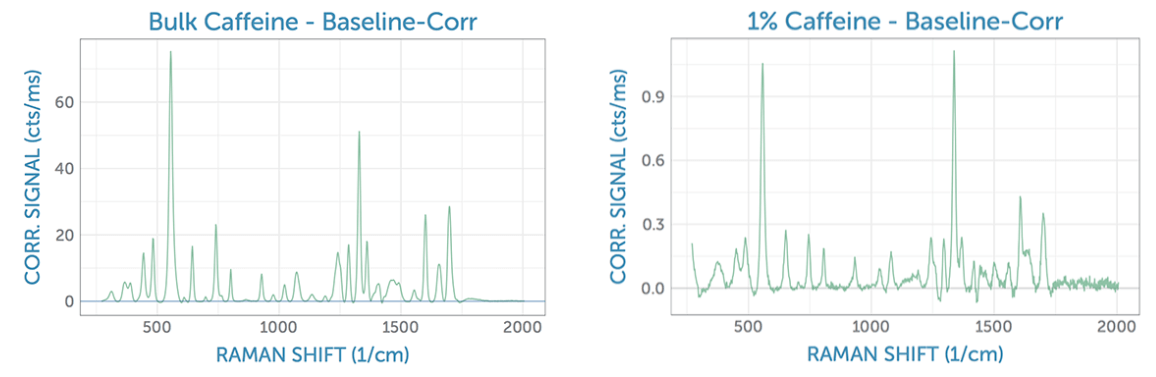
The spectra were individually imported, scaled by the integration time, and baseline corrected using the AirPLS algorithm to isolate a good estimate for the peak heights. For reference, we first measured the baseline-corrected spectrum of bulk caffeine as a solid sample using the 785 nm Raman system. From this, it is possible to clearly identify the two main peaks of caffeine at around 560 cm-1 and 1320 cm-1, which were considered for use in the present analysis. Next, we looked at a 1% aqueous solution, noting that the Raman spectrum shows a minor intensity ratio difference as compared to the bulk spectrum. The overall spectral shape is quite comparable, however, despite a significant reduction in the signal strength and signal-to-noise ratio (SNR) for measurement in solution due to the low concentration.
SERS Raman Spectra
The spectrum of the lower concentration caffeine solutions, amplified by the SERS substrate, is composed of two contributions: the blank substrate background spectrum seen after the addition of water, and the spectrum of the analyte, caffeine. In the following comparison between analyte and blank signal, the characteristic Raman peaks of caffeine are clearly visible.
SERS Signal vs Raman in Solution for Low Concentrations
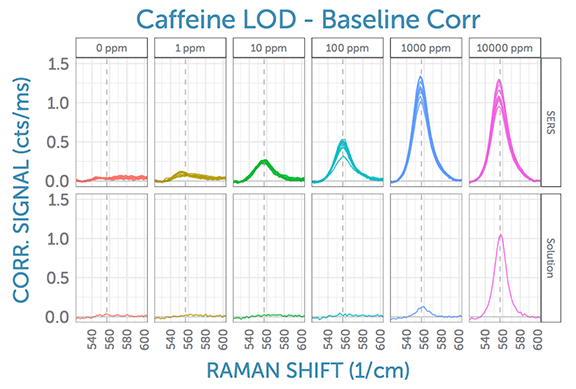
Given that the 560 cm-1 peak of caffeine is well isolated from interferences, it was chosen for our signal analysis to compare the SERS Raman signal in both the original solution and as amplified by the SERS substrate. This side-by-side comparison at all tested concentrations is shown in the following figure, as measured using the 785 nm Raman system. All 10 measured spectra for each concentration are shown. From this, it can be seen that the SERS-amplified signal is still discernible even at the lowest tested concentration of 1 ppm caffeine. In solution, a much higher concentration of 1000 ppm is needed to yield a clear Raman signal under the same conditions.
Also visible is the good reproducibility of the SERS signal – both over time, as well as between different spots on the same substrate. (Remember, for each concentration, two locations on the SERS substrate were measured, and five spectra were collected back-to-back, yielding a total of 10 SERS measurements per concentration).
Looking at the dependence of SERS signal on concentration, the signal does not scale linearly, though it does increase monotonically up to 1000 ppm. Above 1000 ppm, it is likely that saturation occurs due to all SERS sites being occupied with analyte; thus, additional analyte will not lead to further SERS signal. For lower concentrations, the SERS signal appears to decrease in a near-logarithmic fashion, as shown in the figure.
SERS Signal at Different Excitation Wavelengths
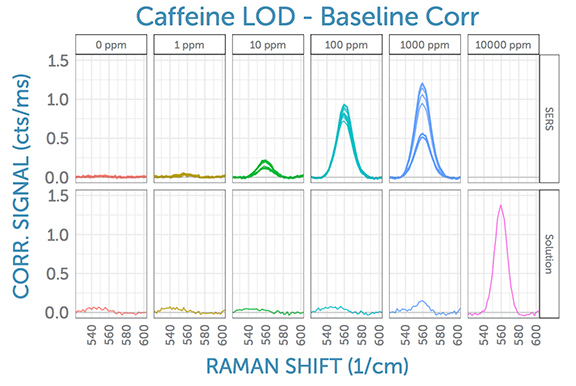
Encouraged by the enhancement possible using the Nikalyte SERS substrates with a laser excitation wavelength of 785 nm, one of the most popular Raman wavelengths, we wanted to take the investigation a step further. For comparison, we also recorded the SERS signal for the same analyte at the same concentrations using 830 nm excitation. This is a wavelength popular for biological samples, as it often results in a significantly lower fluorescence background for complex organic substances.
In doing so, the spectra recorded with an excitation wavelength of 830 nm wer found to be comparable to the 785 nm Raman results. The baseline of the SERS spectra appears to be significantly flatter at 830 nm, as evidenced by the 0 ppm measurements.
Conclusion
In this investigation, we assessed spectra from a new type of SERS substrate from Nikalyte, looking at a typical drug analyte (caffeine). SERS data was collected for two common Raman excitation wavelengths, 785 nm and 830 nm, using compact, cost-effective, field-portable Raman systems from Wasatch Photonics. The analyte was applied directly to the substrates, and no special sample preparation or system modification was required.
These new SERS substrates allowed us to record Raman signals for the main peaks of the analyte down to the lowest tested concentration of 1 ppm. The substrates show good stability in time and reproducibility across different locations on the substrate. Comparing the bulk Raman signal (in aqueous solution) to the SERS signal in the same setup, the SERS substrates enhance the detection of caffeine in water significantly to allow measurement of even the lowest tested concentration, 1 ppm of caffeine in water, achieved independent of the laser wavelength. Future work will look at lower concentrations of analytes to determine limit of detection.
