Exciting options for fluorescence suppression
The trade off between signal strength and fluorescence background often dominates the choice of excitation wavelength for Raman spectroscopy. But what if fluorescence background could be eliminated entirely? UV Raman allows just that. In this application note, we’ll explore its advantages, the technical challenges it has overcome, and some interesting applications. We’ll also explain UV resonance Raman (UVRR), a technique which can yield significant signal enhancement and increased analytical specificity under the right circumstances.
Download the App NoteAvoiding the fluorescence window
The efficiency of Raman scattering scales inversely with excitation wavelength to the fourth power (1/λex4), which in itself makes a good case for UV excitation. In theory, this means that excitation with UV light at 248 nm can generate signals >20x stronger than at 532 nm, or 100x greater than at 785 nm. In practice, however, there is a much more compelling reason for UV Raman excitation: elimination of background fluorescence.
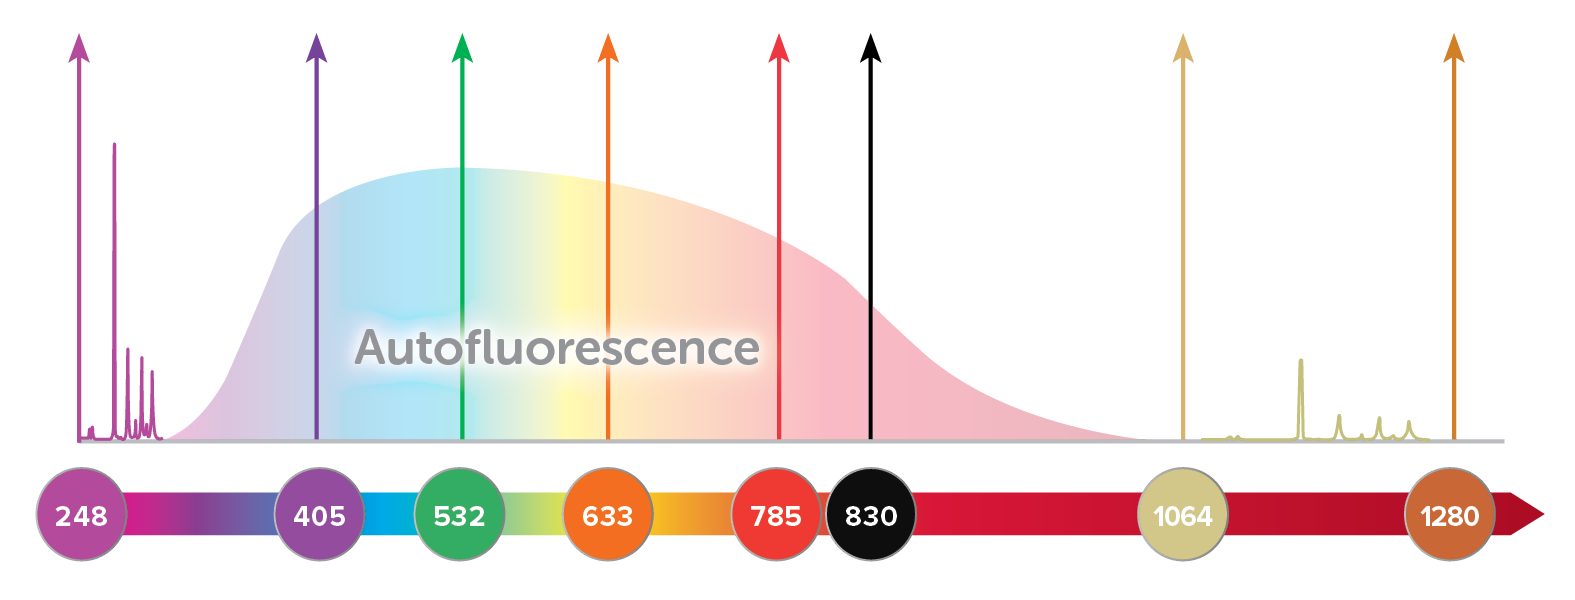
Many Raman active molecules also exhibit fluorescence when excited with a laser, resulting in a broad background that is often several orders of magnitude more intense than the Raman signal. This broad emission may overlap the entire Raman spectrum when visible light is used, reducing the signal-to-noise ratio of the Raman spectrum or obscuring it completely. Fluorescence background is greatest when the molecular structure is complex, such as in organic compounds and biological samples, but may also occur due to fluorescent impurities in the sample. Fluorescence can be reduced by using a longer wavelength like 785 or 830 nm, and eliminated almost completely using 1064 nm, though some biological samples still experience undesirable heating when excited with 1064 nm Raman. (For more details on matching excitation wavelength to your application, read our tech note, Wavelength Matters.)
Another option is to excite and capture Raman spectra at wavelengths below the fluorescence window, using UV Raman. Fluorescence typically occurs at wavelengths longer than 300 nm, and thus by using an excitation laser at or below 266 nm, a full 4000 cm-1 spectral range covering the fingerprint and functional bands can easily be collected with little to no interfering background. In addition, use of an excitation source in the UV range can result in a large resonant enhancement of the Raman signal for some samples, a technique called resonance Raman spectroscopy.
UV Resonance Raman (UVRR)
Conventional Raman scattering is a very weak phenomenon, and one that occurs to some degree regardless of the excitation wavelength used. If the energy of the excitation laser happens to coincide with an electronic transition within the molecule under study, however, the signal may be enhanced by a factor of 102-106, a technique known as resonance Raman spectroscopy. Even excitation close to the electronic transition of a molecule can yield ‘pre-resonance’, generating 5-10x more signal. Resonance Raman allows for faster measurements with better signal to noise ratio, and permits measurement of lower concentrations or even trace detection.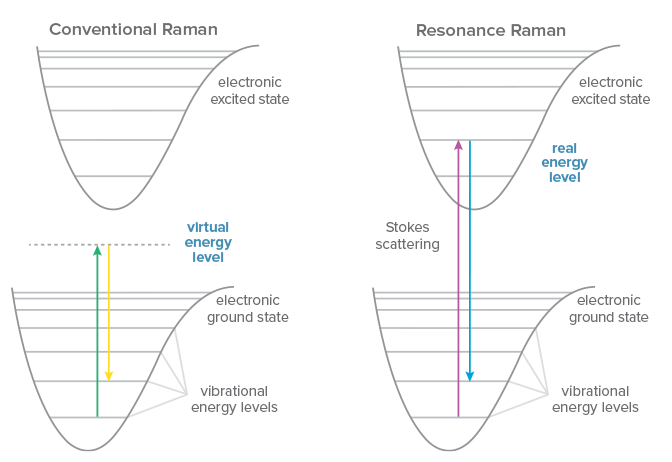
Another benefit of resonance Raman is increased selectivity, because the signal enhancement occurs only for electronic transitions that coincide with the laser wavelength. This can allow preferential excitation of a molecule within a complex sample matrix, or selective enhancement of the signal from a specific subgroup within a macromolecule. UV resonance Raman (UVRR) takes advantage of the resonance of UV light with chromophores and aromatics in complex biomolecules to study the structure and dynamics of proteins and nucleic acids, from folding to interactions and changes in environment. The choice of wavelength determines the specific structure for which resonance occurs, amplifying its signal selectively to yield a relatively simple Raman spectrum despite the complex sample.
Advances in UV Raman Instrumentation
The short wavelength of UV light increases the demands on the instrumentation used for Raman scattering. Although selection may be limited, commercially available components now put UV Raman and UVRR within reach for a much wider range of applications than ever before. Compact, affordable UV lasers with improved lifetime and power output have reduced the size of UV Raman systems. Among these, the most attractive options are NeCu hollow-cathode metal-ion lasers at 248.6 nm and quadrupled, diode-pumped Nd:YAG lasers at 266 nm.
On the detection side, the spectrometer used must be both high resolution and high throughput. If the excitation laser is 248 nm, only ~27 nm of spectral range is needed to generate a 4000 cm-1 Raman spectrum; 0.1 nm resolution is equivalent to 16 cm-1. This requires the longpass filter used for rejection of Rayleigh scatter to be even steeper than its visible equivalents. Given the narrow spectral range in the UV, to collect enough signal in a reasonable measurement time, the spectrometer must be very high throughput. This can be achieved using a high numerical aperture input, efficient optics, and a sensitive detector. Sensitive detection of UV Raman is important to keep exposure times short and minimize potential damage to delicate samples like biological materials.
Applications of UV Raman
UV Raman has been explored for many applications, only some of which exploit the added benefits of UV resonance Raman. In the field of gas measurement, UV Raman has been tested as a method for pressure measurement1, and for trace detection of nitrogen2. It has also been used in combustion studies3, and for analysis of fuel/air mixing4. As a tool for solid-state materials analysis, it can offer insight into structural, optical, and electronic properties of materials fabricated for electronics5. In diamond growth, UV Raman can help characterize and quantify impurities that would fluorescence strongly with visible Raman6.
The suppression of fluorescence background combined with resonant enhancement of signal gives UV Raman an advantage for trace detection of analytes within complex samples, from cocaine in saliva7 to pollutants like carcinogenic PAHs in the environment6. Even the mere reduction in background has shown to aid the characterization of strongly fluorescing, colored food samples like dark beverages and edible oils8. UV Raman is also the preferred technique for stand-off detection of explosives and chemical warfare agents by security forces, though these systems require high power lasers and very specialized optics to achieve the long working distance required9,10.
![]() UV resonance Raman has made its largest impact, however, as a technique for probing molecular structure and dynamics in biological systems. It allows selective excitation of a specific segment of interest within a macromolecule such as an amino acid or nucleic acid, enhancing signal from only that substructure to provide relatively clean Raman spectra from within highly complex samples. This makes it invaluable for studies of protein structure and folding6, as well as the impact of environment or interactions with other molecules11,12. This could make UVRR useful as a monitoring tool in bioprocessing also13. It has even been investigated for use in monitoring the mode of action of antibiotics for specific antibiotic/bacterium pairs14. (For more details on these applications, explore our UV Raman reference list below.)
UV resonance Raman has made its largest impact, however, as a technique for probing molecular structure and dynamics in biological systems. It allows selective excitation of a specific segment of interest within a macromolecule such as an amino acid or nucleic acid, enhancing signal from only that substructure to provide relatively clean Raman spectra from within highly complex samples. This makes it invaluable for studies of protein structure and folding6, as well as the impact of environment or interactions with other molecules11,12. This could make UVRR useful as a monitoring tool in bioprocessing also13. It has even been investigated for use in monitoring the mode of action of antibiotics for specific antibiotic/bacterium pairs14. (For more details on these applications, explore our UV Raman reference list below.)
Conclusion
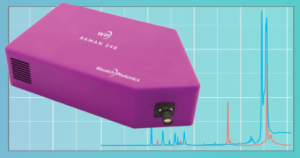
Advances in the technology required to employ UV Raman, like compact lasers and our new WP 248 Raman spectrometer have made this powerful technique more available than ever to a wide range of applications spanning materials analysis, trace detection, and studies of biological structure and dynamics. Addition of UV to your Raman toolkit offers the promise of fluorescence-free spectra and potential signal enhancement through UVRR for some samples, complimenting the wide range of visible and NIR wavelengths currently available for Raman spectroscopy. To find the right excitation wavelength and system setup for your particular application, consult our Designing Raman Solutions tech note, or contact us to discuss your specific needs.
References
- Gu, Y., et al. “Pressure dependence of vibrational Raman scattering of narrow-band, 248-nm, laser light by H2, N2, O2, CO2, CH4, C2H6, and C3H8 as high as 97 bar.” Applied Physics B 71.6 (2000): 865-871.
- Hargis, P. J. “Trace detection of N 2 by KrF-laser-excited spontaneous Raman spectroscopy.” Applied Optics 20.1 (1981): 149-152.
- Raffius, Thomas, et al. “Flame-temperature, light-attenuation, and CO measurements by spontaneous Raman scattering in non-sooting diesel-like jets.” Combustion and Flame 176 (2017): 104-116.
- Grady, Nathan R., et al. “Raman scattering measurements of mixing and finite-rate chemistry in a supersonic reacting flow over a piloted, ramped cavity.” Combustion and Flame 165 (2016): 310-320.
- Liu, Hsiang-Lin, et al. “Deep-ultraviolet Raman scattering spectroscopy of monolayer WS 2.” Scientific Reports 8.1 (2018): 1-10.
- Asher, Sanford A., Calum H. Munro, and Zhenhuan Chi. “UV lasers revolutionize Raman spectroscopy.” Laser Focus World 33.7 (1997): 99-109.
- D’Elia, Valentina, et al. “Ultraviolet resonance Raman spectroscopy for the detection of cocaine in oral fluid.” Spectrochimica Acta Part A: Molecular and Biomolecular Spectroscopy 188 (2018): 338-340.
- El-Abassy, Rasha M., Bernd von der Kammer, and Arnulf Materny. “UV Raman spectroscopy for the characterization of strongly fluorescing beverages.” LWT-Food Science and Technology 64.1 (2015): 56-60.
- Nagli, L., et al. “Absolute Raman cross-sections of some explosives: Trend to UV.” Optical Materials 30.11 (2008): 1747-1754.
- Choi, Sun‐Kyung, et al. “Analysis of Raman Spectral Characteristics of Chemical Warfare Agents by Using 248‐nm UV Raman Spectroscopy.” Bulletin of the Korean Chemical Society 40.3 (2019): 279-284.
- Chinsky, L., et al. “Resonance Raman spectra of poly (l‐lysine), aromatic amino acids, l‐histidine and native and thermally unfolded ribonuclease A.” Journal of Raman Spectroscopy 16.4 (1985): 235-241.
- Jakubek, Ryan S., et al. “Ultraviolet resonance Raman spectroscopic markers for protein structure and dynamics.” TrAC Trends in Analytical Chemistry 103 (2018): 223-229.
- Goodacre, Royston, and Lorna Ashton. “Application of deep UV resonance Raman spectroscopy to bioprocessing.” European Pharmaceutical Review 16.3 (2011): 46-49.
- López-Díez, E. Consuelo, et al. “Monitoring the mode of action of antibiotics using Raman spectroscopy: investigating subinhibitory effects of amikacin on Pseudomonas aeruginosa.” Analytical Chemistry 77.9 (2005): 2901-2906.
- Sapers, Haley M., et al. “Using Deep UV Raman Spectroscopy to Identify In Situ Microbial Activity.” AGUFM 2017 (2017): B11G-1744.
