
Up to 3% of the population in both Europe and North America suffer from gout, a common form of inflammatory arthritis that results in intensely painful bouts of joint swelling, warmth, and redness. Caused by buildup of monosodium urate crystals in the joint space, a gout attack can last for days or weeks, potentially causing permanent damage to joints and limiting motion over time if untreated. Download this tech tip
The challenge with diagnosis of gout in a clinical setting is that it often presents with similar symptoms to pseudogout, a different type of crystal-induced arthropathy, as well as mimicking other forms of arthritis. While larger hospitals have access to specialized equipment and staff to discriminate between these conditions, many smaller clinics and remote facilities reach presumptive diagnosis based on clinical symptoms, which leaves up to 30% of gout sufferers and many with pseudogout diagnosed incorrectly.
A new compact point-of-care device created by researchers at Case Western University seeks to change that by using Raman spectroscopy to provide chemically selective identification of arthropathic crystals in the clinic. Dr. Ozan Akkus and his team have developed a novel digestion and filtration method to isolate crystals from synovial fluid aspirated from the affected joint, using a low-cost disposable cartridge. When analyzed with their shoebox-sized instrument based on a Wasatch Photonics WP 785L integrated Raman system, the presence, identity, and even concentration of crystals can be determined via automated analysis. Spectral Engines LLC is working on developing the technology for clinical use under a Small Business Grant from the National Institutes of Health.
By supplementing diagnosis via clinical symptoms, and even advanced techniques, this new instrument has the potential to speed accurate diagnosis, improve clinical outcomes, and reduce the number of unwarranted hospital admissions. The system has already demonstrated comparable performance to a research-grade high fidelity Raman microscope, and good to excellent agreement with the existing gold standard diagnostic method in a clinical study.
The limit of detection of this point-of-care Raman spectroscopy (POCRS) device has been shown to be more than adequate to observe clinically relevant concentrations of arthropathic crystals, and may even open up new opportunities for early detection of gout and pseudogout, as well as monitoring of treatment.
A thousand tiny needles
Gout and pseudogout are forms of arthritis is caused by the body’s natural inflammatory response to micron-sized crystals deposited in the joint spaces and soft tissues. Gout is seen often as a sudden flare-up in the big toe joint or other joints, and is due to the buildup of needle-like crystals of monosodium urate hydrate (MSU). It is caused by excess uric acid in the bloodstream (hyperuricemia), a byproduct of metabolizing the purines found in foods – meats and alcohol in particular. Chronic sufferers often develop tophi, small white or yellow crystalline chunks, which can be visible through the skin. Prescription drugs and corticosteroids can offer quick relief from a gout attack if taken immediately, and can reduce severity on an ongoing basis for chronic sufferers. Dietary and lifestyle modifications also aid in management.
Pseudogout, though it presents with similar symptoms, is caused by smaller, block-like crystals of calcium pyrophosphate dihydrate (CPPD). Though the reasons for CPPD crystal buildup are not well known, they are present in the joints of a large fraction of arthritis sufferers, and the incidence of pseudogout increases exponentially with age. Pseudogout most frequently affects the knee but can occur in any joint, resulting in it often being misdiagnosed as gout, osteoarthritis or rheumatoid arthritis. While management of pseudogout may include prescription drugs, corticosteroids, and lifestyle modification, diet is not as large a factor.
Getting the right diagnosis
Compensated polarized light microscopy (CPLM) of synovial fluid extracted from the affected is currently the gold standard for diagnosis of gout and pseudogout. It uses a microscope fitted with polarization optics and a rotatable stage, and depends on the ability of a certified operator to assess the sample in dark-field for the presence of birefringent crystals. Crystal identity is determined based on its birefringence – negative birefringence for MSU and positive birefringence for CPPD. While this seems simple enough in theory, it carries an average false negative rate of ~30%, and substantial variability between different labs or individuals. Crystals such as CPPD which are weakly birefringent can easily be missed, as can small crystals.
Due to the need for specialized equipment and training, it is estimated that only ~10% of gout and pseudogout diagnoses are performed via CPLM. While radiography, serum urate analysis, and ultrasound may also be used, none of these techniques are both sensitive and specific for both gout and pseudogout. As a result, many facilities depend on a combination of clinical symptoms for diagnosis, with an accompanying 30% false negative rate. This is particularly common in community health centers and primary care settings, where the majority of arthritic cases present.
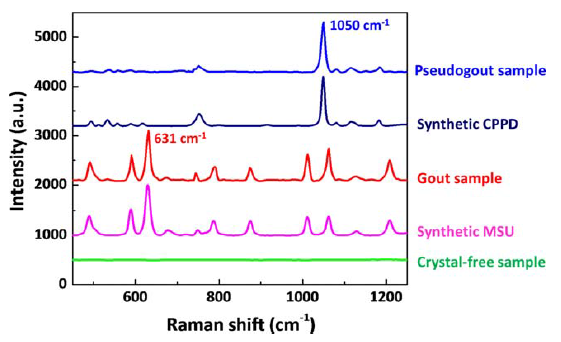
In the research lab, Raman microscopy has been demonstrated successfully for the analysis of synovial fluid for MSU, CPPD and cholesterol crystals. Both MSU and CPPD display strong, distinct Raman fingerprints – MSU with characteristic peaks at 590 and 631 cm−1, and CPPD at 1050 cm−1. In order to translate this technique to the clinic, however, the cost, size, and dependence on the operator needs to be significantly reduced.
The point-of-care Raman spectroscopy (POCRS) system developed by the Akkus group at Case Western University achieves each of these objectives by integrating a novel cartridge for the isolation and concentration of arthropathic crystals in synovial fluid with a compact, cost-effective Raman-based detection instrument using a Wasatch Photonics WP 785L integrated Raman system. It opens up the potential for unbiased and unsupervised diagnosis of crystal species at the point of care, and within one hour of fluid collection – eliminating the need for fluid collection, storage and shipment to a certified operator for crystal detection via CPLM.
Sample concentration via microfiltration
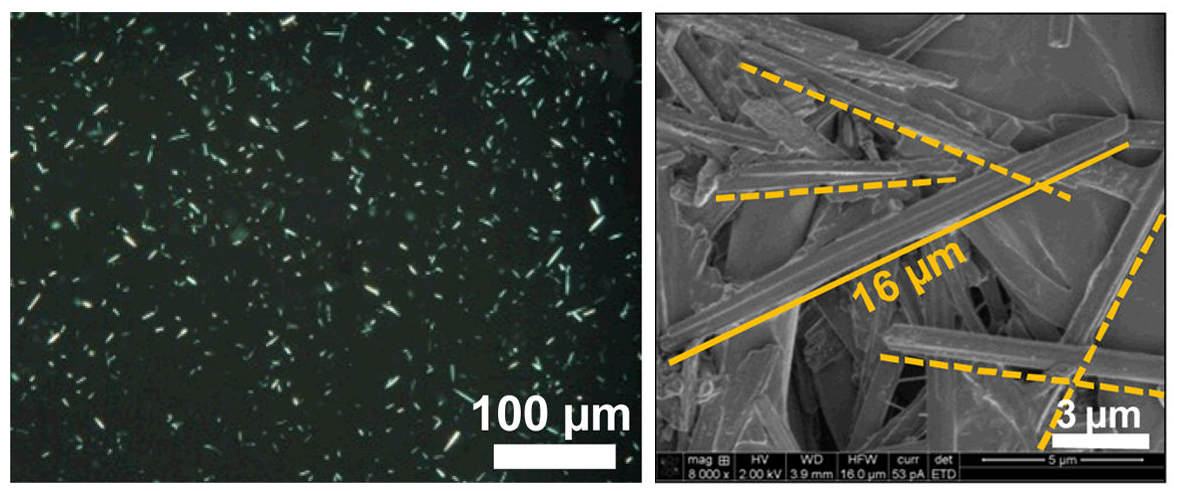
To achieve sufficient signal, Raman spectroscopy requires direct overlap of a small focal spot size (~70 μm) with the crystals of interest (up to 20 μm in length), requiring a method of preparing the synovial fluid sample such that the crystals could be concentrated for detection. This is accomplished using a custom-fabricated microfilter cartridge mounted at the tip of the syringe holding the sample.
Polarized light microscopy has shown that clinical MSU crystals tend to aggregate within the organic debris of the sample, so each sample is first subjected to a brief digestion phase (60 minutes) using hyaluronic acid to release the debris into the synovial fluid for more effective filtering and isolation of any crystals that may be present in the sample.
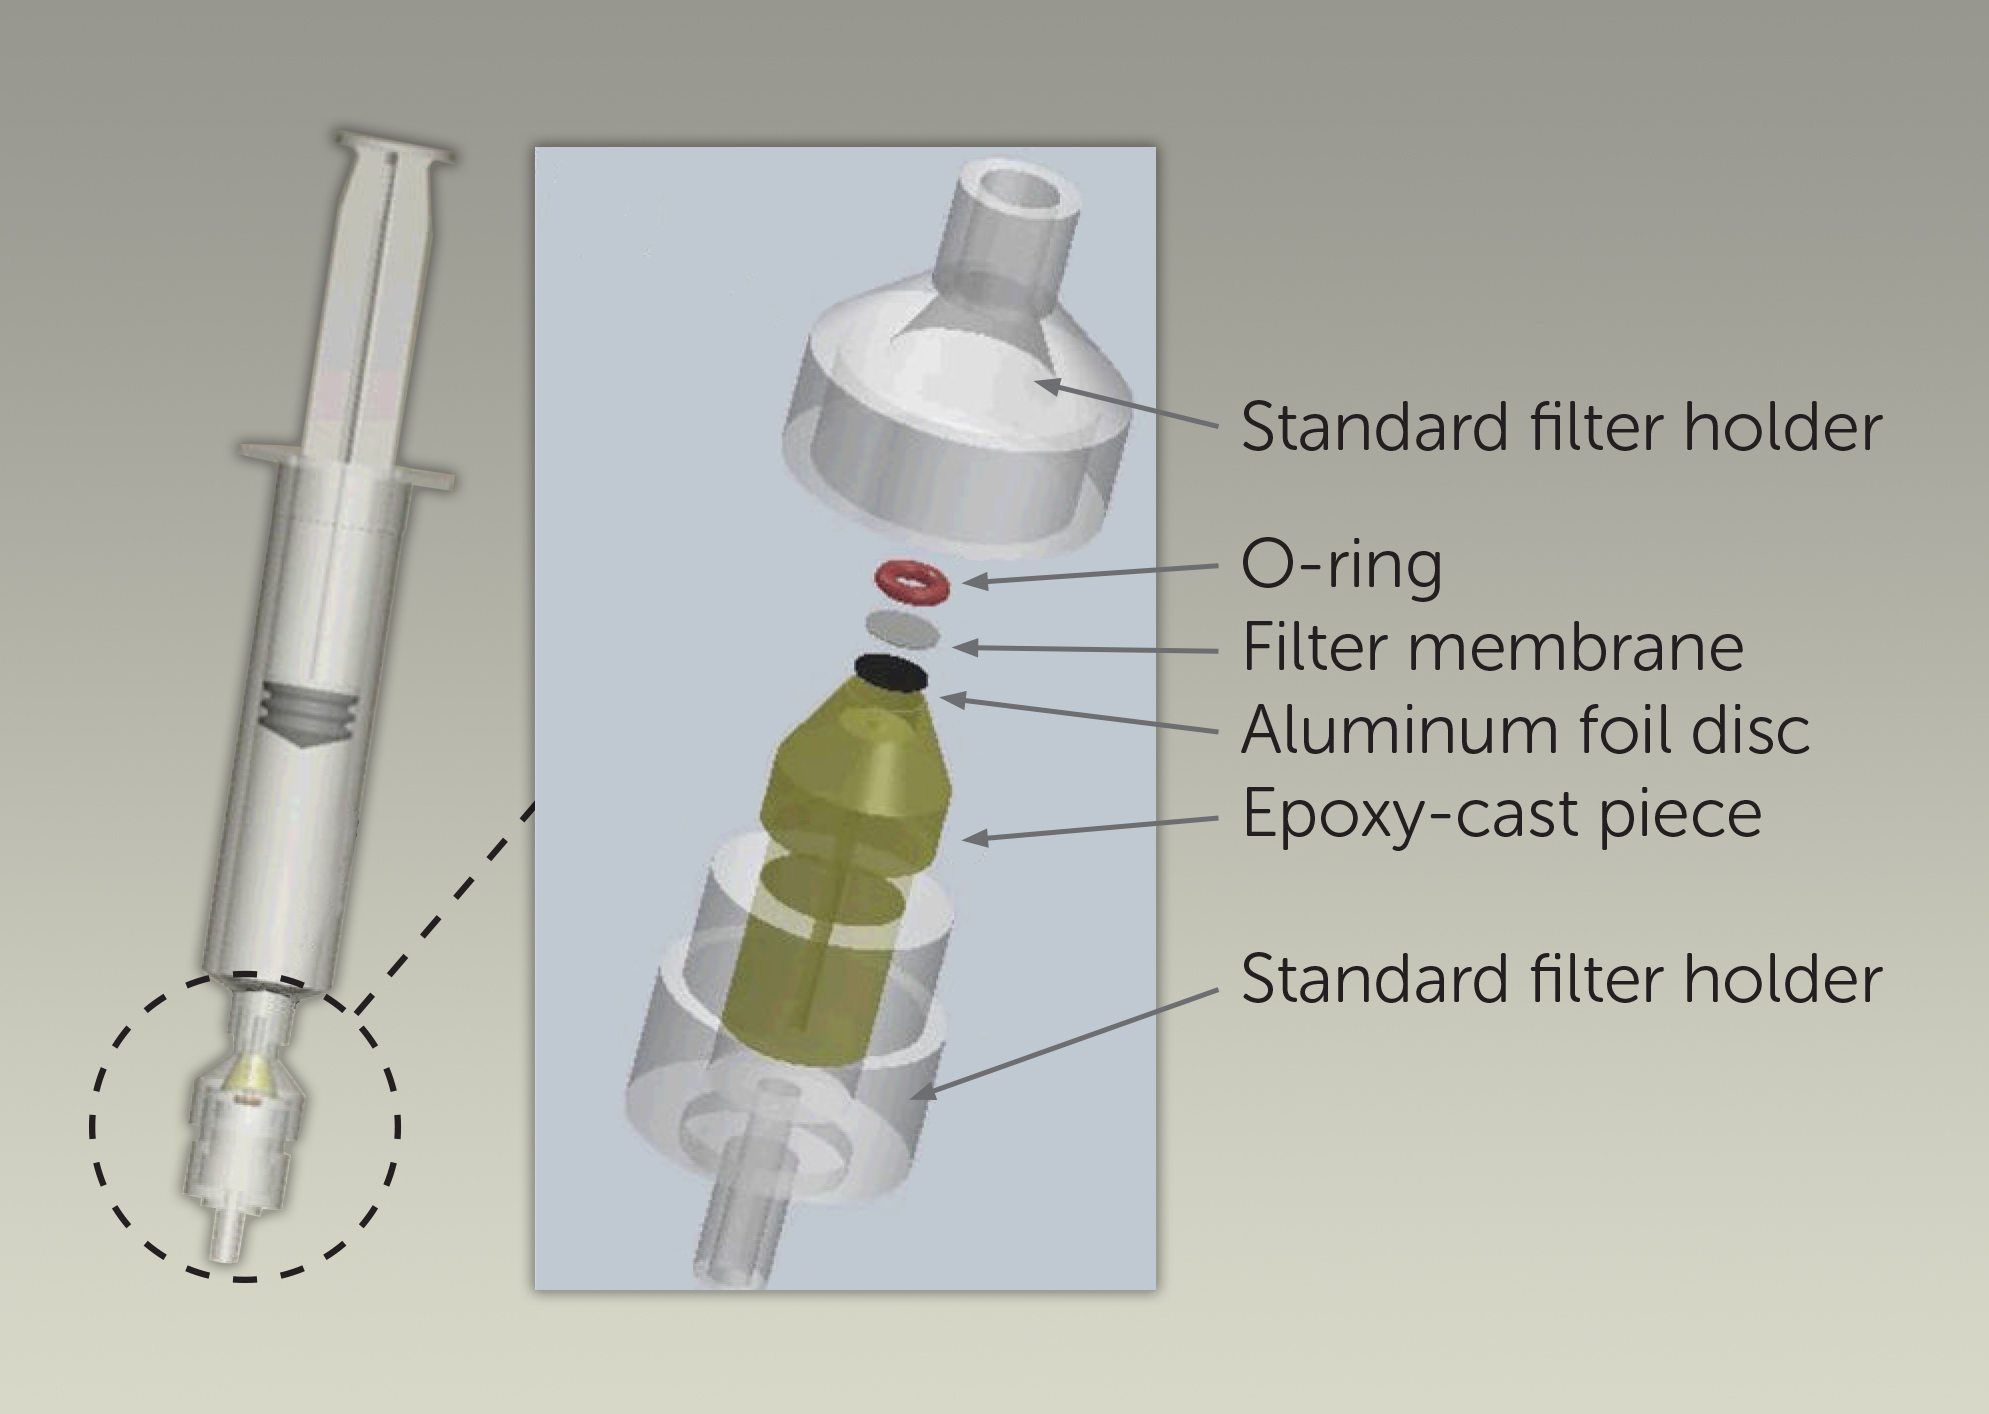
One milliliter of the digested synovial fluid is then pushed down through the filter cartridge (inset) slowly over a period of <60 seconds, concentrating the crystals into a ~0.9 mm diameter spot bounded by an O-ring on a polypropylene filter membrane. An epoxy-cast piece allows free flow of synovial fluid and organics through the filter holder, while an aluminum foil disc blocks any interfering laser-induced fluorescence from the epoxy during Raman analysis.
Following the filtration, the filter cartridge is removed from the syringe and inserted in the POCRS instrument to position the spot containing crystals at the focal point for Raman analysis.
Sensitive, consistent Raman analysis
The compact POCRS instrument includes four major subunits: a highly sensitive Wasatch Photonics Raman system adapted for OEM use (WP 785L), a receptacle for insertion of the filter cartridge that was mounted on a translation stage, a servo motor to move the translation stage, and a micro-controller to drive the servo motor.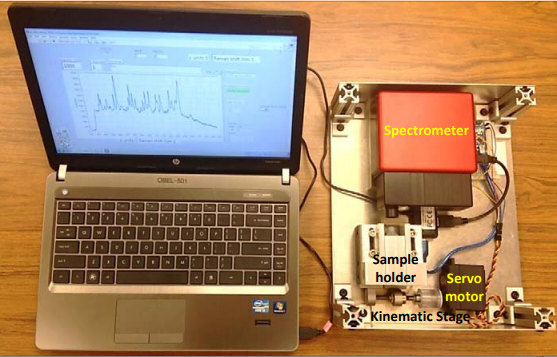
The WP 785L integrated Raman system includes a Raman spectrometer with a spectral resolution of 10 cm−1 (50 µm slit width) and a 785 nm laser, delivering approximately 50 mW of laser power over a ~70 μm spot on the sample via a single lens with 25 mm focal length. The low f-number of this system (f/1.3) maximizes the Raman signal that can be collected from the sample for lower limit of detection.
The POCRS is programmed to acquire spectra from 30 sampling points at ~30 μm step size across the diameter of the 0.9 mm sample area of the filter cartridge to increase the likelihood of overlap with deposited crystals and thus improve the detection limit. To minimize fluorescence background from the organic material present, spectra are taken with 0.5 second exposure, averaging 60 scans at each step. This short acquisition rate is possible due to the sensitivity of the transmissive spectrometer design.
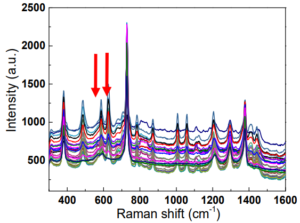
The Raman spectrum acquired at each point is then processed in a series of steps. Fluorescence background is removed using a 2nd order polynomial fit to the background, and the intensity of the resulted background-corrected spectra normalized using the 809 cm-1 peak of the polypropylene membrane. The peaks originating from the polypropylene are removed by subtracting the normalized spectrum of a pure polypropylene membrane from the normalized spectra of the analyte. This yields a signal to noise ratio of ~60 for a typical sample.
 As can be seen by looking at the processed spectra of clinical MSU crystals (green spectrum) vs synthetic MSU crystals (blue spectrum), for highly concentrated samples, most peaks (491, 590, 631 cm−1, etc.) could be recovered after the background correction and subtraction of the polypropylene spectrum. In this application, the main MSU associated peaks at 590 and 631 cm−1 and CPPD associated peak at 1050 cm−1 are sufficient for confirming the existence of crystals.
Running the gauntlet of samples
The sensitivity and selectivity of the POCRS instrument to detect MSU and CPPD crystals has been validated through a variety of tests with synthetic and clinical samples to determine limit of detection and ability to measure in synovial fluid. Comparison of results against established techniques such as Raman microscopy, SEM, and CPLM affirms the ability of the technique to accurately determine the presence and identity of crystals in synovial fluid.
Establishing Limit of Detection (LOD)
Synthetic MSU and CPPD crystals mixed in phosphate buffer saline (PBS) supplemented with uric acid were used to determine the limit of detection and to establish calibration curves to estimate crystal concentration. A series of dilutions from 0.1 – 50 μg/mL were measured for MSU, and from 0.1 – 100 μg/mL for CPPD. For each concentration, three samples were measured, summing the intensity of the Raman peaks of interest over a full thirty point scan, repeating for three randomly chosen cross sections. The coefficient of variation of signal intensity over the three cross sectional measurements of a given cartridge ranged from 2% to 8%.
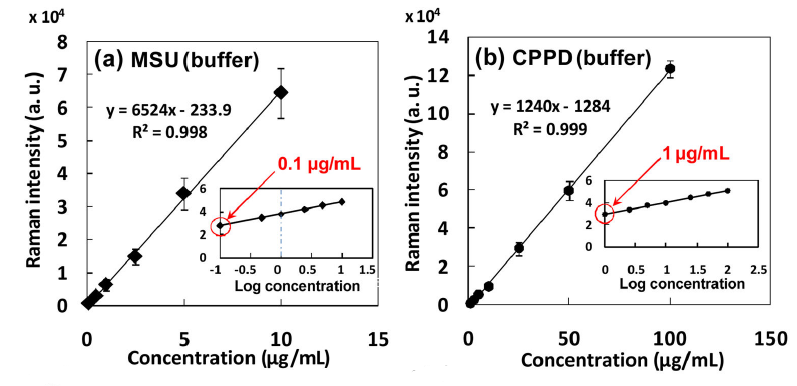
Plotting the summation value for each concentration against the known synthetic crystal concentration established a limit of detection as low as 0.1 μg/mL for MSU crystals, and 1 μg/mL for CPPD. (The concentration at which at least one scan provided identifiable analyte signal was defined as the LOD.) It is believed that the LOD for MSU was lower than that of the CPPD crystals due to their morphology – being longer and thinner in shape, the equivalent mass will be distributed amongst a greater number of individual crystals, making them easier to detect.
Given that clinical samples are reported anecdotally to be in the range of 10-100 μg/mL, the measured limit of detection of the POCRS system is well below the clinically relevant concentration in both cases. This bodes well for the ability of the technique to detect crystal-related arthritis more sensitively than current techniques, and at an earlier stage.
Synovial fluid: Bridging the gap with clinical samples
As the next step towards clinically relevant measurements, synthetic MSU and CPPD crystals were mixed in non-symptomatic synovial fluid without any history of joint disease to determine the limit of detection in the presence of synovial matter. A series of dilutions from 0.1 – 50 μg/mL were measured for MSU, and from 0.1 – 100 μg/mL for CPPD.
While the synthetic CPPD crystals showed similar Raman intensities for the samples in non-symptomatic synovial fluid vs PBS buffer, the synthetic MSU crystals in non-symptomatic synovial fluid showed significantly lower Raman intensities at concentrations from 1 to 10 μg/mL. This may be due to the thin shape of MSU crystals, which could more easily be attenuated by residual organic phase on the membrane when isolated from synovial fluid. CPPD crystals may be less prone to this effect due to their thicker brick-like shape.
Validating the method – from SEM & Raman microscopy to CPLM
Scanning electron microscopy (SEM) and Raman microscopy were performed to validate the presence of crystals and their identity. SEM provided visual confirmed the presence of patient isolated crystals on the polypropylene membrane that are consistent with the expected size and shape. Raman microscopy performed with a Horiba Jobin-Yvon Xplora system afforded chemical images of crystal distribution across the membrane based on the intensity of the 631 cm−1 peak of MSU, and spectrally validated the presence of crystals on the membrane following the filtration process. This demonstrated that MSU crystals were dispersed by the across the deposition area at various intensities as a result of the isolation and filtering process, in agreement with results from the POCRS instrument.
With the ability of POCRS to isolate and quantify MSU and CPPD crystals established, the next step was to perform a benchmark study against the “gold standard” of gout and pseudogout diagnostics – compensated polarized light microscopy (CPLM). To this end, 174 clinical samples from synovial fluids from symptomatic patients were analyzed both by POCRS and CPLM. CPLM analyses were conducted by rheumatologists or pathologists with >20 years of experience in CLIA-certified laboratories, while the POCRS analyses were completed using the automated system already described.
Using POCRS, the MSU crystal concentration varied from 0.1 mg/ml to 84.3 mg/ml, while CPPD crystal concentrations ranged from 2.5 mg/ml to 109.0 mg/ml. Overall, POCRS and CPLM results were consistent in 89.7% of samples (156 of 174). For the diagnosis of gout, the kappa coefficient for POCRS and CPLM was 0.84 (95% confidence interval [95% CI] 0.75–0.94), indicating excellent agreement between the two methods. A small number of samples identified by POCRS as being positive for MSU crystals were missed by CPLM, and vice versa.
For the diagnosis of pseudogout, the kappa coefficient for POCRS and CPLM was 0.61 (95% CI 0.42–0.81), indicating good agreement between the two methods. For the diagnosis of pseudogout, CPLM and POCRS showed 151 negative samples and 11 positive samples. It is interesting to note, but not entirely surprising, that 11 samples identified by POCRS as containing CPPD crystals were missed by CPLM, as CPPD crystals are known to be challenging to detect microscopically due to their weak birefringence. If POCRS is able to detect these crystals more consistently than CPLM, it may offer clinicians additional data to aid in the diagnosis of pseudogout.
It must be emphasized that the POCRS method identifies the type of crystals, and this information alone would not constitute a conclusive diagnosis of gout or pseudogout. The diagnoses of gout and pseudogout remain clinical diagnoses, but are highly contingent on the identification of MSU and CPPD crystals, respectively, in synovial fluid from inflamed joints.
In practice, it is hoped that CPLM and POCRS will be seen as complementary in the diagnosis of gout and pseudogout, enabling clinics not equipped to perform CPLM to quickly screen for the presence of crystals contributing to gout and pseudogout vs other arthropathic conditions.
Conclusion
Raman spectroscopy offers a chemically definitive and highly sensitive method for the identification and eventual quantification of crystals in synovial fluid causing gout (MSU crystals) and pseudogout (CPPD crystals) versus other arthritic conditions. By taking a practical and low cost sample preparation approach using a disposable syringe-filtration technique for isolating crystals, a submillimeter spot of highly concentrated crystals can be quickly analyzed using a fully integrated and automated Raman analysis instrument (POCRS) incorporating a Wasatch Photonics integrated Raman system. This relatively low-cost point-of-care instrument would offer a much greater number of clinics the ability to detect clinically relevant concentration of arthritic crystals in synovial fluid using minimally trained staff, thus complementing clinical assessment of symptoms, and even CPLM.
By improving the accuracy and availability of correlated diagnosis, this POCRS device for the diagnosis of gout and pseudogout has the potential to reduce the length of urgent care/ER stays, hospital admission rates due to false diagnoses, and improve patient reported outcomes. As we look to this and other Raman-based techniques for point-of-care diagnostics, time spent in the clinic looks just a little less painful.
References
Li, Bolan, Shan Yang, and Ozan Akkus. “A customized Raman system for point-of-care detection of arthropathic crystals in the synovial fluid.” Analyst 139.4 (2014): 823-830.
Li, Bolan, et al. “A Point‐of‐Care Raman Spectroscopy–Based Device for the Diagnosis of Gout and Pseudogout: Comparison with the Clinical Standard Microscopy.” Arthritis & Rheumatology 68.7 (2016): 1751-1757.
https://www.arthritis-health.com/types/gout/all-about-gout-symptoms-diagnosis-treatment
Roddy, Edward, and Michael Doherty. “Gout. Epidemiology of gout.” Arthritis research & therapy 12.6 (2010): 223.
A special thanks to Dr. Ozan Akkus for sharing his group’s fascinating work, and for his assistance in writing this article.
