GRATINGS +1 435.752.4301 SPECTROMETERS +1 919.544.7785 OCT +1 919.544.7785
GRATINGS +1 435.752.4301 SPECTROMETERS +1 919.544.7785 OCT +1 919.544.7785

The NEW WP 1064X series is the most comprehensive family of 1064 nm OEM Raman spectrometers available. As Raman spectroscopists. we understand that each application is unique. As such, we know that every Raman spectroscopist requires specific configuration options to optimize their research or product development. Solving this unmet need was why the X series was created. We deliver the features, software & support you need for Raman:
Ideal for maximum fluorescence suppression, 1064 nm Raman is often preferred for complex organic or biological materials and/or highly absorbing samples such as certain oils, polymers, inks, varnishes, and semiconductor materials. The choice between a flexible, probe-based Raman system and a fully integrated, compact one depends largely upon which optical coupling method is best for your application or sample. Sensitivity, size, and laser control may also be considered. If you have a vision, we have the knowledge & experience to help you create your ideal solution. Learn more about our system configuration options
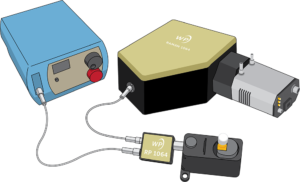
FULLY MODULAR SYSTEM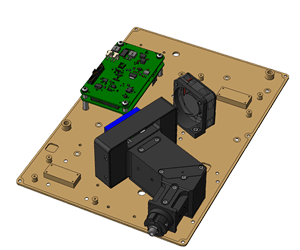 A fully modular Raman system uses fibers to route excitation light between laser, probe, and spectrometer. This is ideal for bringing Raman to the sample.
Start with the WP 1064X-IC-OEM
SEMI-INTEGRATED SYSTEM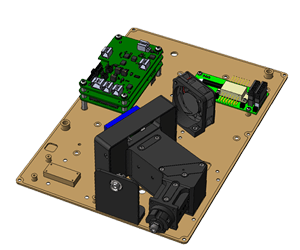 A semi-integrated Raman system combines the spectrometer and laser into a compact, cost-effective footprint, with direct laser power control via software.
Start with the WP 1064X-ILC-OEM
FULLY INTEGRATED SYSTEM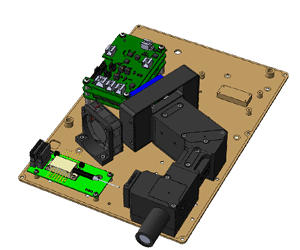 A fully integrated Raman system combines the laser, sampling optics, and spectrometer with high optical efficiency, offering direct laser power control via software.
Start with the WP 1064X-ILP-OEM
| DETECTOR COOLING OPTIONS | |||
| TEC-Cooled (-C) | |||
| SPECTROMETER (-IC model) | Spectral range | 225-2500 cm-1 | |
| Resolution (25 µm slit) | f/1.3 input | 8 cm-1 | |
| Detector TEC setpoint | -15 ± 0.2°C | ||
| Minimum integration time | 1 ms | ||
| OPTIONAL INTEGRATED LASER (-ILC, -ILP models) | Laser type | 1064 nm, multimode | |
| Laser power | Up to 450 mW, controlled via ENLIGHTENTM software | ||
| OPTIONAL INTEGRATED PROBE (-ILP model) | Working distance (from face of lens) | 22 mm | |
| Laser spot size (nominal) | 120 µm | ||
We offer only one input aperture option for the WP 1064X, which is optimized for maximum signal (f/1.3). A lower f/# optical bench results in a higher collection efficiency, and thus a higher signal level, so choose our f/1.3 configuration option to get the highest signal spectra. Our spectrometers with f/1.8 input aperture will give you slightly less signal than their f/1.3 counterparts, but will improve the resolution.
We offer a 25 μm slit as standard for the WP 1064X series, and 15 & 50 μm slits as options to achieve better resolution or more throughput, respectively. Sensitivity and resolution are competing factors when choosing slit size. A larger slit allows more light to enter the spectrometer, increasing sensitivity for low-light applications. Resolution improves, however, as slit width is reduced (though not always linearly). Due to the high sensitivity of our low f/# spectrometer designs, it is often possible to use a smaller slit width than would be required with a typical f/4 spectrometer, allowing you to achieve higher resolution. These are available at shorter wavelengths.
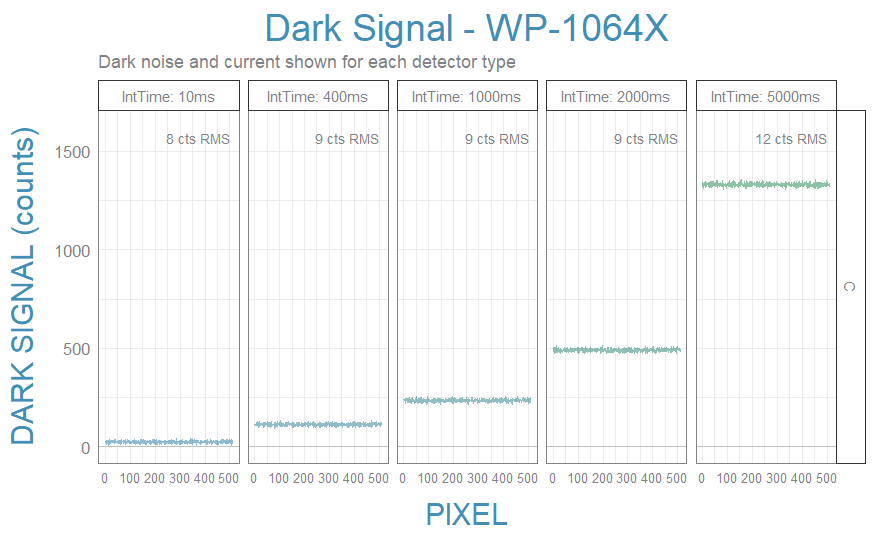
We offer only a TEC-cooled detector cooling for the WP 1064X series for greatest signal and thermal stability with lowest noise:
Due to the superior optical throughput of the X series, the majority of users are able to operate at integration times of 1000 ms or less. This makes the WP 1064X suitable for most applications, even for challenging Raman samples. Need advice? Contact us to discuss what’s best for your specific application.
| SPECTROMETER (-IC) | SPECTROMETER + LASER (-ILC) | SPECTROMETER + LASER + PROBE (-ILP) | |
| Spectrometer input | Fiber-coupled SMA 905 connector (FC/PC, free space collimating lens, or open slit upon request) | Fully integrated sampling optics: 22 mm working distance, 120 µm laser spot size on sample |
|
| Laser output | N/A | FC/PC connector | |
| Communications | USB 2.0 Type B connector | ||
| Software / control | ENLIGHTENTM Raman spectroscopy software & SDKs included |
||
| Library matching | Identify Raman spectra via Wiley's KnowItAll Raman Spectral Library (free trial, fully integrated into ENLIGHTENTM) |
||
| Operating temperature | 0°C to 40°C, non-condensing | ||
| Dimensions & weight | Laboratory/housed units: 24.3 x 17.2 x 6.0 cm, <2.3 kg OEM modules on a baseplate: 23.6 x 16.5 x 5.3 cm, <1.3 kg |
||
Our free ENLIGHTEN™ spectroscopy software has all the features and control you need to quickly and easily collect Raman spectra from Wasatch Photonics spectrometers. View your spectra live, overlay current data with previous scans, or export raw and processed spectral data for further analysis. Learn more
Software development kits (SDKs) are also available to enable custom software development. We’ve created these drivers for developers who want to integrate our spectrometers into your own Python or C# applications, or for advanced users who wish to control our spectrometers from interactive graphical environments like LabVIEW or MATLAB. Download now

Wasatch Photonics Raman spectroscopy customers receive a complimentary trial of Wiley Science Solution’s KnowItAll Raman Identification Pro for spectral identification. Accessible through the Wasatch Photonics ENLIGHTEN software, users benefit from the comprehensive, high-quality database of reference Raman spectra in a single software application, thereby enhancing the user experience. Wiley offers the largest collection of Raman spectra in the world along with fast and accurate spectral search software. How it works
Our Raman spectrometers are far more sensitive and higher throughput than the average compact spectrometer – to give you better spectra in less time. We’ve made them robust & reproducible enough to give reliable answers in the lab, the field, or the hospital. We offer more configurations than any other Raman spectrometer provider, and help you to find the right fit through our expertise & experience, supported by Raman-specific software tools with full data transparency so that you have full control over data analysis. We care enough to listen to our customers and respond, and we will listen to your needs to help you get the best solution possible. Select one of the icons below to learn more about a specific capability, or download the full tech note describing our benefits:


The X series uses a highly configurable optomechanical design that is scalable from 1 to >1000, making it quick & easy to customize to a wide range of applications and use case requirements. By tailoring each spectrometer or Raman system to your unique needs, you get maximum performance at far less weight and cost than with traditional benchtop Raman. These units cover the fingerprint and functional region with <10 cm-1 resolution, making them suitable for most identification, diagnostic, and process applications. Each unit comes with onboard calibration data for spectral response and wavelength, which ensures high spectral accuracy and unit-to-unit reproducibility. We offer several measurement setups, and advice on Raman spectroscopy system design.
Our robust, modular optomechanical design adapts to your unique application needs with options to balance signal and noise with resolution, power consumption, and degree of system integration. Design your own, or let our expertise & testing guide you to the best configuration for your needs. Configuration options include:
We created the WP 1064X for emerging OEMs – researchers and instrument manufacturers who are developing innovative new applications of Raman that require a compact module and/or portable Raman spectroscopy system. That’s why we use the same sensitive, robust & highly reproducible optomechanical design for both the laboratory & OEM versions of our WP 1064X series spectrometers and systems. This allows you to complete proof of concept and method development with a laboratory 1064X series system, then transition directly to the equivalent OEM module for volume production – with no change in performance or need to update your matching libraries or chemometric models. You get the stability and reproducibility of an OEM instrument and research-grade results from day one, and reliable data you can use to build models for use in the field. More ‘OEM Inside’ benefits:
Learn more about our OEM philosophy, capabilities, and support ⇒
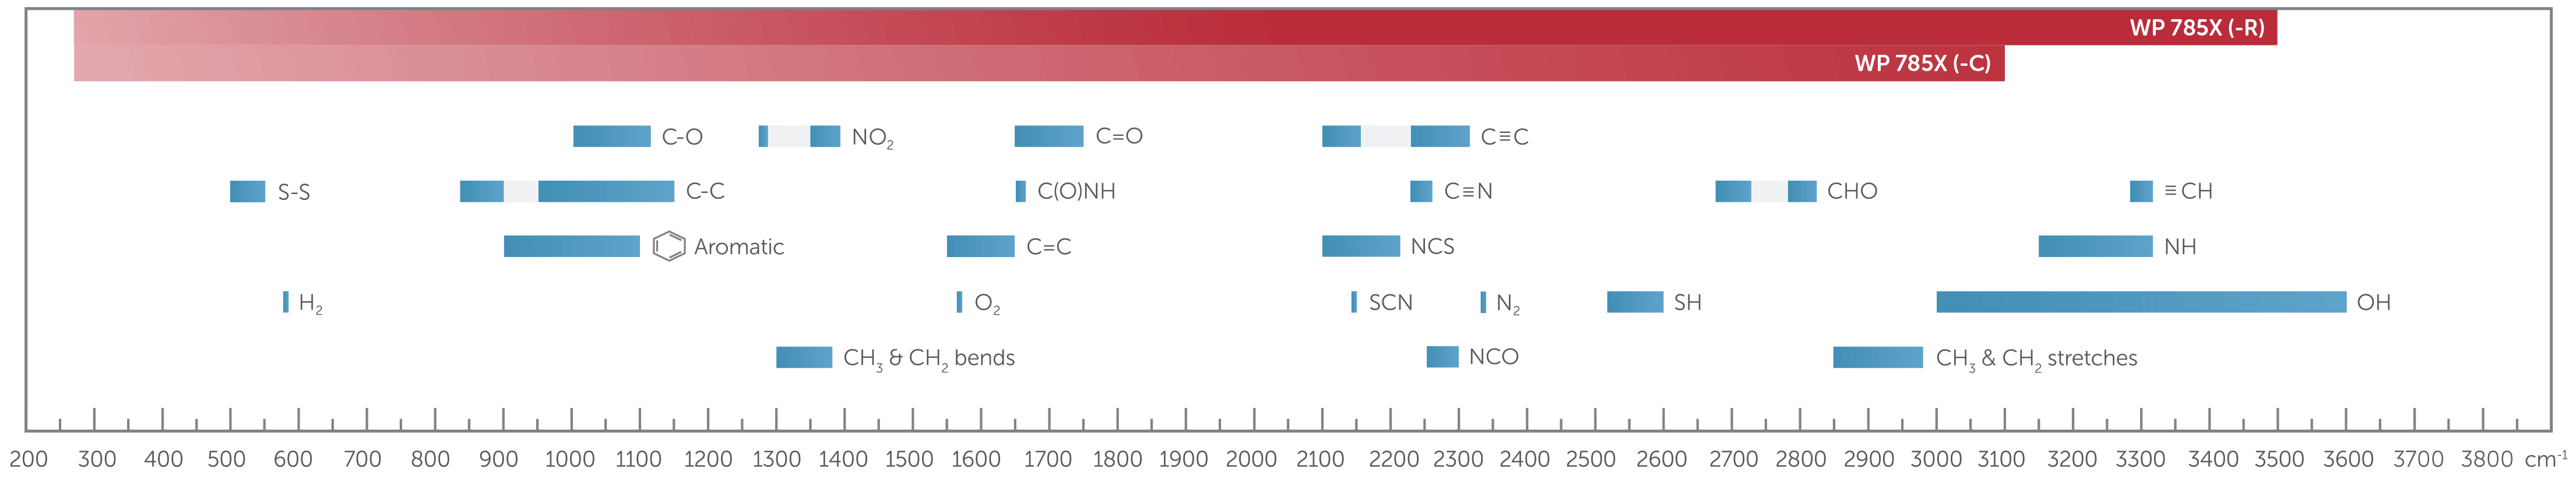
The pattern of peaks in a Raman spectrum is unique to the sample, providing a fingerprint which can be used to identify or analyze the material. The ‘fingerprint’ region up to 1500 cm-1 is often enough to confirm identity, while the extended ‘functional’ region out to 3600 cm-1 includes bands for additional, functional groups in a molecule. In addition to our standard models, we can design custom range spectrometers for OEMs. See below for common Raman spectral bands and how they compare to the range of the WP 1064X with TEC-cooled (-C) detector.
Need something slightly different? We offer a higher-end line of Raman spectrometers for the most challenging measurements, and OEM modules that are even more compact than the X series for handheld instruments. Consider the option below, or explore our full family of Raman products.
Each WP 1064X OEM Raman spectrometer or system is a fully functional module suitable for OEM R&D, prototyping, and production with consistent performance. Learn more about our our ‘OEM by design’ philosophy.
WP 1064X-IC-OEM
WP 1064X-ILC-OEM
WP 1064X-ILP-OEM


Choosing the right Raman wavelength for your application is a question of balancing sensitivity and selectivity. Although shorter wavelengths deliver the strongest Raman signal, fluorescence background can degrade signal-to-noise ratio (SNR) if the wrong wavelength is used. That’s why we offer wavelengths from 532-1064 nm, matching your specific needs and sample type to the best wavelength for the application. Click on the buttons above to explore our alternate wavelengths. Still unsure of what you need? Read our tech note, Choosing your Raman excitation wavelength, or contact us for a personal consultation or sample testing.
