Raman spectra identification using integrated KnowItAll spectral search and library from Wiley Science Solutions.
We’ve integrated our ENLIGHTEN™ spectroscopy software with access to the world’s largest Raman spectral database to give you the power to collect spectra and perform Raman library matching in one easy-to-use program, for rapid material identification. As a KnowItAll* Raman Spectral Identification Partner, we can now match against more than 25,000 spectra relevant to the physical and life sciences for sample identification, verification and validation.
Perform material identification using a convenient window in ENLIGHTEN™, making it easier than ever to harness the power of Raman spectroscopy using our instruments. Match against KnowItAll’s extensive library – or create your own custom library against which to match your spectra.
ENLIGHTEN™’s New Raman Library Matching Features
Embedded Raman library matching – collect & analyze spectra in a single program
“Fingerprint” icon activates KnowItAll’s spectral search algorithms for rapid ID
Dynamic tool tips alert you to implement key settings for most accurate results
Clear compound identification through an animated message area
Matching score to assess quality of the analysis
Option to “Display all” results from KnowItAll, with matching score for each
Built-in spectral processing to ensure confident library matching (see more below)
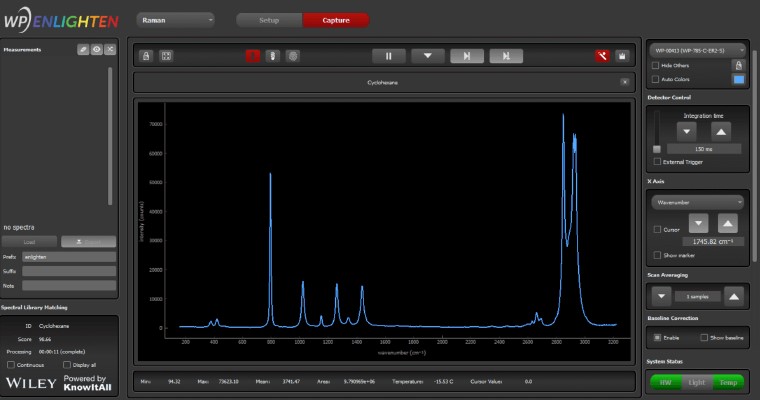
How does KnowItAll work with ENLIGHTEN™?
You will receive a free trial of KnowItAll Raman Identification Pro with your purchase of any Wasatch Photonics Raman instrument.
Installing KnowItAll on your computer allows our ENLIGHTEN™ software to call KnowItAll’s powerful spectral identification engine, accessing its library of 25,000 compounds to display search results in an embedded window in ENLIGHTEN™.
This comprehensive library includes a wide range of compounds, including organics and inorganics, with specialty libraries covering drugs, fragrances, polymers, nutraceuticals, and many more. See the full list of libraries here.
If you already own a WP spectrometer or system and want to perform Raman library matching, contact us to return your unit for the appropriate calibrations.
How do we ensure the best match in ENLIGHTEN™?
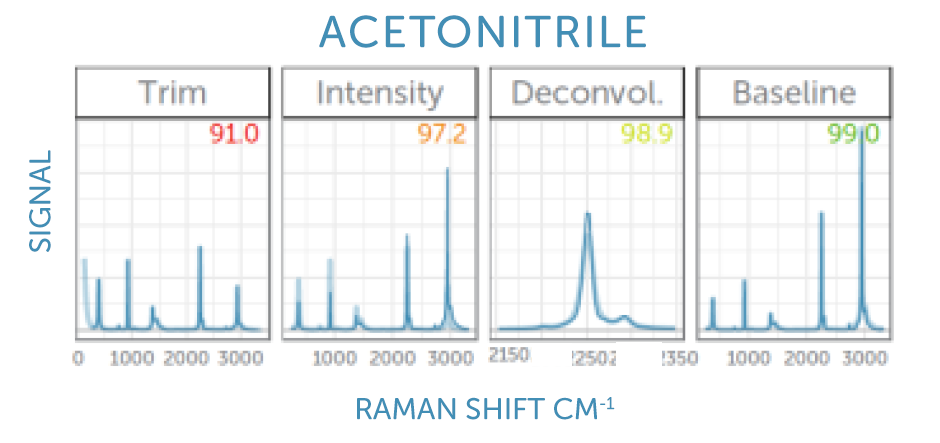
We implement multiple spectral pre-processing steps before sending our spectra to the KnowItAll spectral identification engine to guarantee the most confident match against their extensive Raman library. These steps address spectral response, range & resolution, and baseline to ensure a ‘like-for-like’ comparison against the library. Learn more about these corrections and why they are important in our FAQs below.
“Region of Interest” Trimming: The spectrum is trimmed to remove the spectral extremes where the laser blocking filter is active and or detector sensitivity is low.
Intensity Calibration: We correct for the instrument’s unique spectral response function, determined at our factory using a standard reference material (SRM).
Deconvolution: We mathematically ‘sharpen’ the spectral peaks to more closely resemble the high resolution spectra in the library, which were acquired using benchtop instruments.
Baseline Correction: We fit a smooth curve to any potential background fluorescence spectrum and subtract this to yield a background-free Raman spectrum similar to those in the library.
KnowItAll Spectral Software & Libraries: KnowItAll is a trademark of John Wiley & Sons, Inc. in certain jurisdictions. KnowItAll’s integrated toolsets draw on Wiley’s Sadtler™ libraries and spectra from trusted partners. Wiley Sadtler spectra were measured using rigorous protocols , while matching is performed using their KnowItAll spectral search, optimized for speed and performance.
Frequently Asked Questions
<strong>What is library matching?</strong>
Raman spectroscopy generates unique spectra for every molecule. In library matching the software compares the sample Raman spectrum with a collection of Raman spectra in a database and tries to find a very similar, matching, reference spectrum. The sample spectrum and the reference spectrum should agree on the positions of the peaks, their shape, and their relative heights.
<strong>How is library matching done?</strong>
The matching is usually performed in one of two ways. One method identifies the peak positions and peak heights in the sample spectra and compares those to a table of peaks for the reference spectra, looking for a good overlap. More commonly, though, the algorithm determines the correlation coefficient between the sample and the reference spectrum, and picks the highest correlation as the best match. Sometimes the list of reference spectra is trimmed prior to calculating the correlation by using the peak table.
<strong>What is the matching score?</strong>
Most commonly the matching algorithm determines the (Pearson’s) correlation coefficient between the sample spectrum and the reference spectrum on a common (interpolated) wavenumber scale. The correlation yields a number between 0 and 1, with 1 indicating the perfect match and 0 indicating no similarities. Sometimes the correlation coefficient is multiplied by 100 to yield a score (or “hit quality index”, HQI) between 0 and 100.
<strong>How can I be confident that the match is correct</strong><strong>?</strong>
Even for the best database and algorithm, a match can be incorrect, so it is important to use good judgment and not accept every match blindly. A high matching score, typically 95 or better, can instill confidence. If chemically speaking the match is completely different from the expected molecular class of the sample, especially with a somewhat lower score, one could try to record a repeat sample spectrum for example in a different container. Lastly, many compounds have different names, for example, trivial names or IUPAC chemical names. If you do not recognize a trivial name you receive as a match, look it up to find the proper IUPAC name.
<strong>What acceptance threshold should I set</strong><strong>?</strong>
A score over 95 is considered very good, and over 90 is often still acceptable. A score below 90 indicates a more questionable match, so an acceptance threshold of 90 constitutes a reasonable setting.
<strong>What can go wrong with library matching</strong><strong>?</strong>
There can be two types of errors in library matching: For one, the algorithm might not find a match, either because the sample spectrum is not part of the library or because the sample spectrum suffers from interference that is not sufficiently corrected, leading to a low score below the acceptance threshold. This error will lead to a “no match”. It is less common that the algorithm returns a high score for the wrong match, which can sometimes happen for chemically very similar compounds. This would constitute a “wrong match”.
<strong>Can I use my own sample library</strong><strong>?</strong>
Yes, the stand-alone software performing the matching also allows importing user spectra that can be saved as an additional user library. This is useful for very specific user samples that might not be in the standard library.
<strong>Can any Raman system be used for matching</strong><strong>?</strong>
No, not every Raman system is suitable for matching. Successful matching requires that additional calibrations are performed on the spectrometer to allow for a correction for individual, spectrometer-specific, behavior, leading to a corrected spectrum that can be matched to a spectral library that was recorded with a different spectrometer.
<strong>What is an intensity calibration</strong><strong>?</strong>
Different wavelengths of light can lead to different signal intensities even if the same light intensity hits the spectrometer, which is caused by combination of the spectral throughput of filters, gratings, or the detector quantum efficiency. This total spectral efficiency function is determined by measuring the emission spectrum from a standard reference material (SRM) excited with the Raman laser. By comparison between the measured and the expected spectral shape one can determine the correction factor for every wavelength, the spectral correction function, which follows a smooth curve and can be fitted to a suitable functional form.
<strong>Why do I need an intensity calibration</strong><strong>?</strong>
The reference library was recorded with a separate Raman spectrometer system with a different spectral transmission function. However, the reference spectra are intensity-corrected, so the peak heights recorded with these two different instruments will agree as long as the sample spectrum is also intensity corrected.
<strong>What is baseline correction</strong><strong>?</strong>
Sample containers, contaminations, or the Raman sample itself can lead to a fluorescence pedestal or background signal. Unlike the sharp peaks in the Raman spectrum, a fluorescence background is broad and smooth, and the Raman peaks grow out of this background. A baseline correction fits a smooth curve that approaches the minima of the combined fluorescence plus Raman spectrum from below, this fit is subtracted, yielding the background-free Raman spectrum.
<strong>Why do I need baseline correction</strong><strong>?</strong>
The reference library is recorded with a 1064-nm Raman system to avoid any fluorescence background. If the recorded sample spectrum features a significant background fluorescence, it will no longer match the reference spectrum unless the fluorescence background is subtracted prior to matching.
<strong>What is the “Region of Interest” trimming</strong><strong>?</strong>
To eliminate any laser signal from the longer-wavelength Raman spectrum, long pass filters are used in the optical path to capture any remaining laser scatter. These filters can lead to an onset of the recorded signal, starting from zero in the region blocked by the filter, with the transition covering only a short wavelength range. The region of interest (ROI) trimming limits the spectrum to the region not affected by the filter.
<strong>Why do I need ROI trimming</strong><strong>?</strong>
As no signal is recorded in the spectral region blocked by the laser filter, library matching with such a spectrum would lead to poor matching scores. By trimming the spectrum, this blocked region is not considered by the matching algorithm, improving the matching significantly.
<strong>What is Deconvolution or Sharpening of the spectrum</strong><strong>?</strong>
The library reference spectra are recorded with a large, high-resolution, lab bench instrument, while the sample spectrum is recorded with a compact modular spectrometer with slightly more limited resolution. Deconvolution is a mathematical method to correct for the limited resolution of the compact spectrometer, recovering the original spectrum with sharper lines.
<strong>Why do I need to sharpen the spectra</strong><strong>?</strong>
A comparison of a high-resolution reference spectrum with a sample spectrum with more limited resolution could lead to poor matching scores in the case of a spectrum with very sharp peak, for example naphthalene. For such a sample, the matching score will improve significantly when correcting for the limited resolution in the sample spectrum by deconvolution (or sharpening).
 We’ve integrated our ENLIGHTEN™ spectroscopy software with access to the world’s largest Raman spectral database to give you the power to collect spectra and perform Raman library matching in one easy-to-use program, for rapid material identification. As a KnowItAll* Raman Spectral Identification Partner, we can now match against more than 25,000 spectra relevant to the physical and life sciences for sample identification, verification and validation.