GRATINGS +1 435.752.4301 SPECTROMETERS +1 919.544.7785 OCT +1 919.544.7785
GRATINGS +1 435.752.4301 SPECTROMETERS +1 919.544.7785 OCT +1 919.544.7785
‘What makes a world-class spectrometer – one that allows you to push the boundaries of analytical research but not manufacturing capabilities?’
 That’s a question I have been asked and debated at length over many years. It was this question we set out to answer at Wasatch Photonics when we designed our new WP-series spectrometers for Raman, fluorescence, and VIS through NIR. Our goal was to build a product with a robust opto-mechanical design, electronic interfaces that match use cases for academic, industry and OEM’s alike, and – most importantly – the ability to make those precious photons work for you through elegant optical design. As such, we have combined our experience and skills with what the market requested to deliver on these goals with our new WP-series spectrometers. In the content to follow, you will see the competitive data to support our performance claims, and a little of how we have gone about it.
Thank you for sharing a little of our excitement in regards these new products – we have similar tech notes for our NIR and fluorescence product lines and will be sharing application notes in our newsletter. We always appreciate your input, so please let me know personally if you have any comments or questions.
Why Wait? Take spectra in <1/10th the time!
One of the primary advantages of our f/1.3 optical design is high throughput – to our many users, this translates into taking spectroscopic measurements much faster. Deploying a high numerical aperture (NA=0.36), low f-number optical design that utilizes our highly transmissive, patented volume phase holographic (VPH) gratings along with scientific grade, high quantum efficiency back-thinned detectors gives the new WP-series spectrometers the ability to capture signal faster than any f/4 spectrometer.
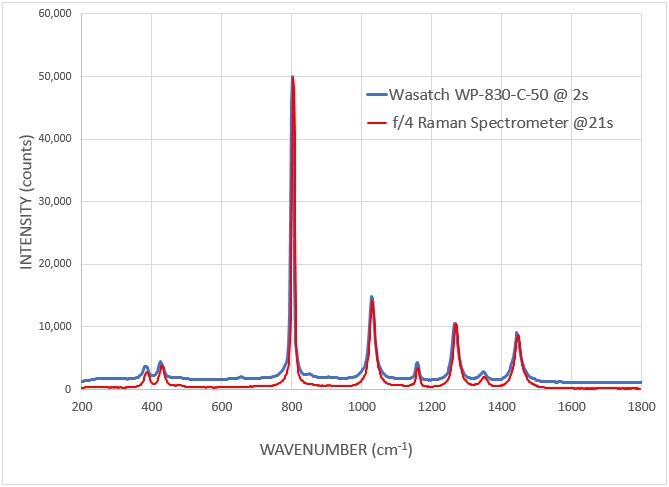
This impressive speed can be seen in the Cyclohexane Raman Spectra below, which shows the acquisition times for the WP-830-C-50 spectrometer and a competitor’s TEC cooled 830 nm f/4 design spectrometer for a fixed 28 mW of 830 nm excitation laser intensity. The WP spectrometer collects 50,000 counts in 2 s whilst the competitive f/4 design spectrometer requires 21 s to achieve the same signal intensity. This is even more impressive since the f/4 spectrometer is fitted with a 100 μm slit whilst the f/1.3 WP spectrometer is fitted with a 50 μm slit.
If you need to measure flowing materials, in-process reaction changes or simply don’t want to hold your hand-held device for as long, then our high throughput spectrometers are here to help you.
So Why wait? Take high quality spectra over 10 times faster with Wasatch Photonics!
Why Settle? Get 20x better sensitivity!
Photons are precious in many applications of spectroscopy, so Wasatch Photonics has designed and built an optical bench that allows you to capture, keep and detect more photons so you can push the boundaries of your science just like we have pushed the boundaries with our designs.
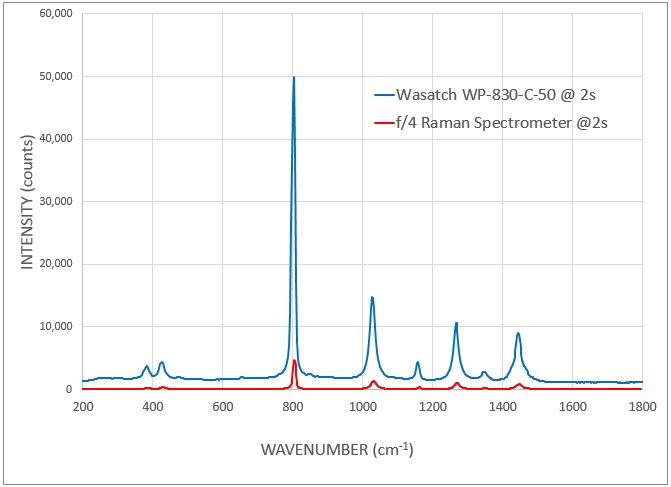
As the figure below shows, for fixed laser excitation wavelength and fixed integration time the WP-830-C detects 10x more signal vs a competitive f/4 spectrometer.
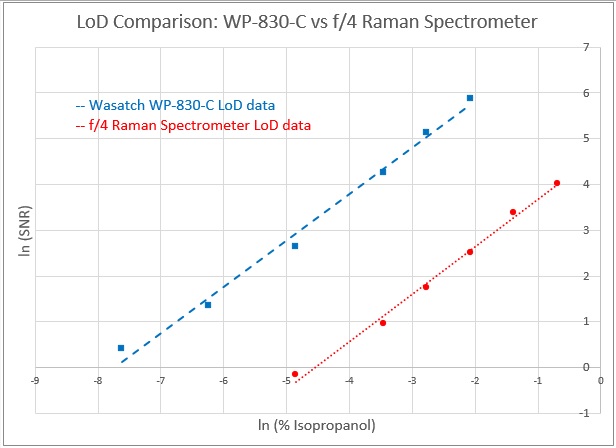
This increased sensitivity allows you to significantly improve the limit of detection (LoD) of your experiment or instrument. The graph below shows the WP-830-C LoD for Cyclohexane for a SNR of 3 being 0.13% whilst for the competitive f/4 unit the LoD is 3.06%. This is >20x improvement of LoD vs the competition allowing you to see lower concentrations of samples than ever before without compromising on size or cost.
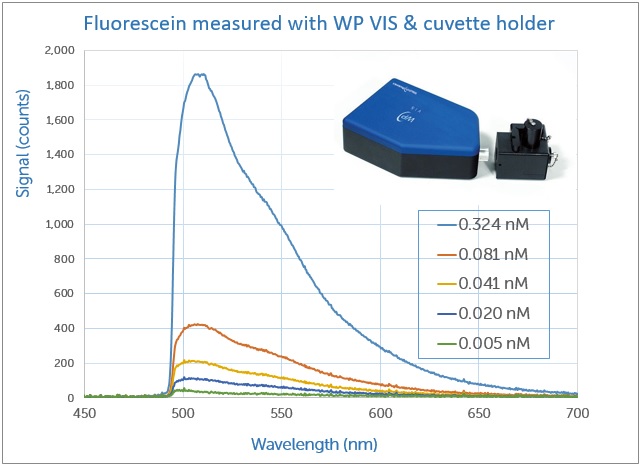
We’ve demonstrated that this sensitivity also translates to fluorescence in a previous tech note, in which the WP VIS was used to measure fluorescein easily at concentrations as low as 5 pM at acquisitions of just 50 ms. See the full experiment.
So Why Settle? Get 20x improvement in LoD and take your measurement capability to the next level.
Why Compromise? Reduce stray light for more accurate measurements.
The holy grail of spectrometer design is collecting all the ‘good’ photons but eliminating all the ‘bad’ stray ones. Why? Well, any off-axis stray light only serves to diminish the quality of the spectral integrity leading to compromised performance, notably in regards the limit of detection for Raman and fluorescence studies and the optical dynamic range for absorbance.
To minimize the impact of stray light in a compact spectrometer, you can either deploy a low stray light designed optical bench or apply mechanical or software corrections to a more generic cross Czerny-Turner design. At Wasatch Photonics, we started out with high throughput, low stray light and excellent spectral uniformity as a design goal – a goal we are proud to say we successfully reach in all our spectrometers.
Our optical bench, uniquely, is designed with our internally manufactured, patented HD VPH grating at its heart – with transmission at greater than 97% across its full spectral range and low off-axis light, our spectrometers exhibit the full benefits of the design.
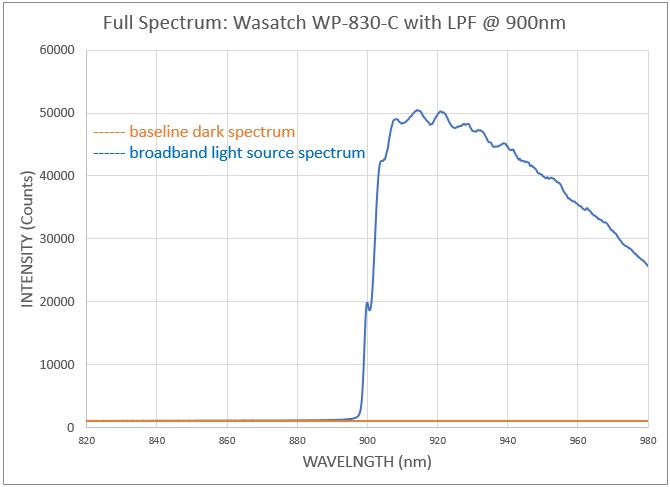
To compare the stray light performance for 785 nm and 830 nm excitation wavelength Raman spectrometers from Wasatch Photonics and competitors we use the following optical set-up. A 900 nm long pass filter is used to block all photons from shorter wavelengths but transmit all photons from higher wavelengths from a broadband light source. By comparing the spectral response of each spectrometer for ‘lamp on’ and ‘lamp off’ we can determine the amount of stray light in each design when configured for Raman spectroscopy.
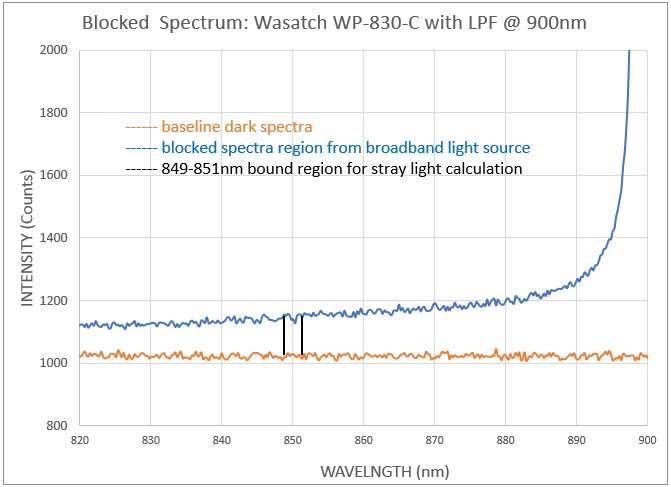
A ‘lower bound’ and ‘upper bound’ spectral region is chosen for the analysis. The lower bound in each case is shown in the graph below by the vertical black lines, and we use the average signal (blue trace) minus background (orange trace) across this bound for the calculation. The upper bound covers 10 nm either side of the maximum signal and again the average signal minus dark value in this region is used in the calculation. The ratio of the Upper to Lower bound values then determine the % Stray Light in the optical bench.
For the Wasatch Photonics WP-830-C unit the % stray light determined by this method is 0.007% whilst the % stray light for the competitive f/4 TEC cooled 830 nm Raman device was 50% worse at 0.015%.
So why compromise? With lower inherent stray light Wasatch Photonics Raman spectrometers give you superior performance.
Why Compensate? Use our thermally stable, reproducible spectrometers.
It’s all well and good providing industry leading optical performance, but unless the spectrometers can withstand fair usage and environmental changes then all that performance counts for nothing.
As spectroscopists ourselves, we know that being able to trust the spectroscopic data in different ambient conditions is paramount. Sure, it’s always best practice to calibrate your instrument to provide accurate spectral matching, but the less you need to worry about this the better.
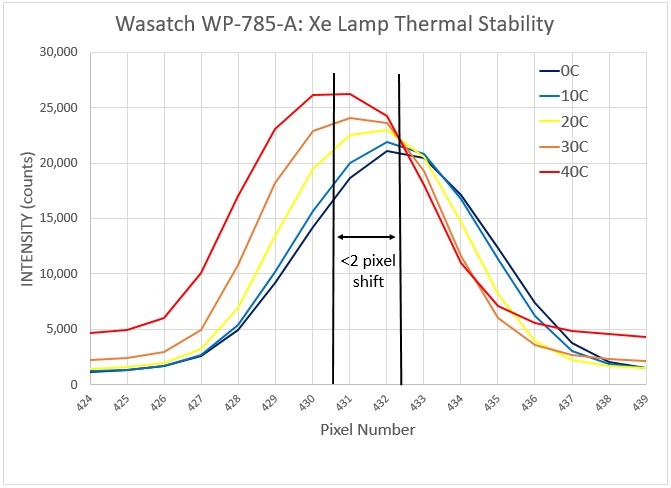
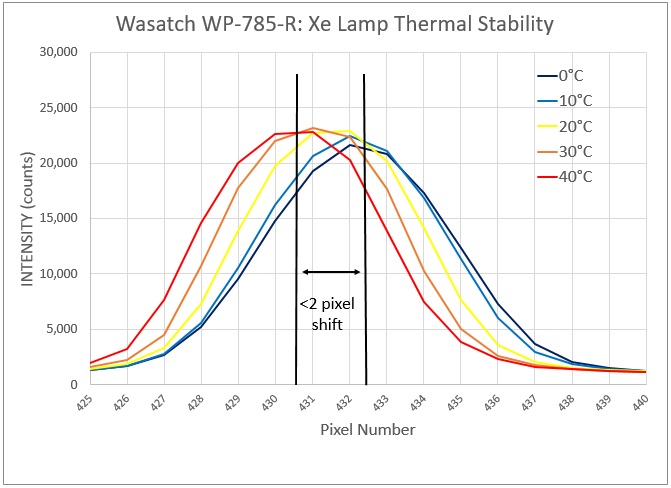
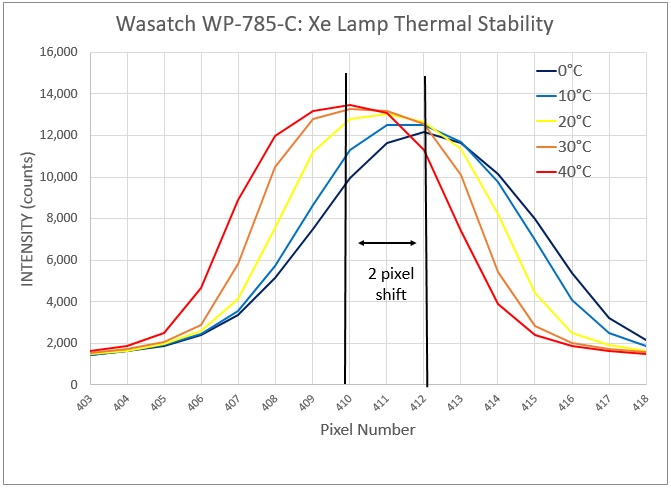
To validate our impressive thermal stability, we placed our WP 785 series Raman spectrometers in our thermal chamber and measured the atomic emission spectrum of a Xe light source as a function of ambient temperature.
When temperature cycled between 0 °C and 40 °C the new WP-series standard (SR) and extended (ER) range Raman spectrometers exhibit a < 0.05 pixel per °C thermal shift, or a total of 2 pixels or less over the range 0°C to 40°C.
This thermal stability is inherent in the opto-mechanical design, as you can see from the graphs below. All detector options – ambient (room temperature operation), regulated (10°C operation) and cooled (-15°C operation) – exhibit very similar results.
In addition to pixel shift, peak symmetry determined by the R2 of the peak is an important factor in spectral and library matching algorithms. Since the Xe source peak shape suffers limited distortion during thermal cycling, this provides an additional benefit of the robust of opto-mechanical design of the WP-series spectrometers.
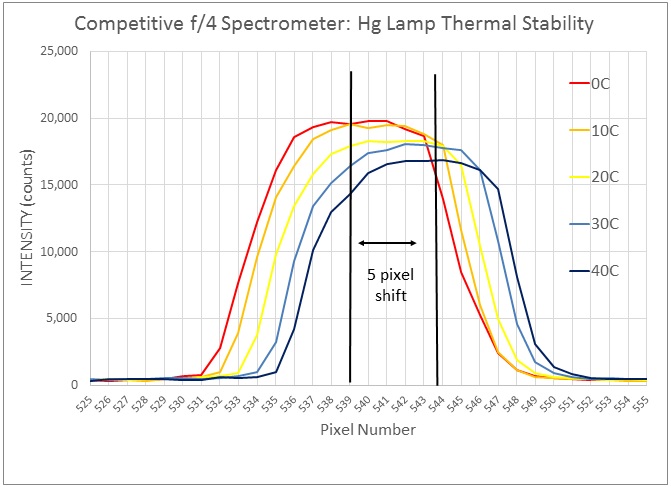
For our Ambient and Regulated products, which have 14 μm wide pixels, this data equates to an approximate 25 μm shift over 40°C. If we look at the specifications of most f/4 miniature spectrometer vendors then they discuss shifts significantly greater than this for their products. For example, for a detector with 1024 pixels, each one 25 μm wide, a leading vendor quotes ± 0.06 pixel per °C or a 60 μm shift, i.e., a shift >2x greater than the WP-series model. For an additional vendor with a 2048-pixel model, each pixel 8 μm wide, we measured a 5-pixel shift over 40°C using the same thermal chamber but using an Hg atomic emission source. This equates to 40 μm of lateral movement which is close to 2x worse than the WP 785 Raman spectrometer.
So Why compensate? Uniquely, Wasatch Photonics offers superior optical performance in a thermally stable spectrometer, giving you high quality data you can rely on.